Executive Summary
A Murabaha (cost-plus) auto-finance book, underwritten by a conventional captive under the same origination standards and serviced through the same infrastructure, is not riskier than the conventional captive’s own book and earns a higher risk-adjusted return over the full stress envelope tested.
Using a fully Canadian-anchored credit-risk framework — PD calibration, LGD engine, portfolio construction, Monte Carlo loss simulation, and a revenue & RAROC model — anchored on DBRS Morningstar’s Ford Auto Securitization Trust II (“FAST II”), Canadian Black Book value retention, Equifax Canada Market Pulse, and Statistics Canada 2021 Census data, we produced paired 50,000-path Monte Carlo loss distributions for a 10,000-loan halal book and its conventional peer on the same applicant pool.
| Headline metric (canonical base-case book) | Halal | Conventional | Halal advantage |
|---|---|---|---|
| Expected loss, CAD | 224,339 | 288,539 | −64,200 (−22.2 %) |
| Unexpected loss @ 99 % VaR, CAD | 642,731 | 770,578 | −127,847 (−16.6 %) |
| Value-at-Risk 99 %, CAD | 867,071 | 1,059,117 | −192,046 (−18.1 %) |
| RAROC (pre-tax, on UL99 capital) | 33.33 % | 15.83 % | +17.50 pp |
| RAROC after charity-offset adjustment | 32.62 % | 16.45 % | +16.88 pp |
All five pre-registered research hypotheses (H1–H5) are supported at 5 %/99 % confidence. The halal RAROC remains above the conventional RAROC in all four stress scenarios tested (mild, severe, vehicle-only shock) and across every sensitivity knob in the feasible range. One boundary is preserved — an existence boundary rather than a risk phenomenon: the Murabaha margin must be set above 6.5 % or the FICO-APR tier gate rejects every feasible FICO band and the halal book has no qualifying pool to write.
Why the halal book earns a higher risk-adjusted return — the H1 pricing-structure thesis
The risk-adjusted-return advantage is generated by the product mechanics, not by a risk-transfer engineering trick. The thesis hypothesis (H1) rests on two linked sub-claims, which the other four hypotheses then statistically confirm:
- The high-quality-credit Muslim applicant pool exists. FSA-weighted sampling (2021 Census Muslim population × StatCan median household income) delivers a Muslim-weighted applicant draw with a mean FICO of 774 and mean household income of CAD 98,575 — materially above the conventional national-weighted draw (mean FICO 769, mean income CAD 93,050). There are enough prime-credit Muslim buyers in the addressable Canadian market to fill a uniformly-priced book.
- Uniform Murabaha pricing extracts alpha from that pool. Every qualified borrower pays the same monthly payment for any given {cash price, term} listing — an 800-FICO borrower pays the same CAD 718 monthly as the 680-FICO marginal qualifier. That constraint mechanically produces the FICO-APR tier gate (Gate 1 of the 4-gate qualification cascade): at an 8.5 % margin, the entire sub-680 FICO tail — whose rate-card APR would be 10.49 %+ — is structurally excluded at origination. The prime pool that survives is then priced at the full 8.5 % margin, the same margin the marginal qualifier would pay, and the high-FICO mass contributes expected revenue well above its expected loss. This is the alpha source.
H2 through H5 are the statistical confirmations that the H1 structural mechanism shows up in the loss and return distributions. Mean annual PD on the qualified halal pool is 92.5 bp lower than conventional (H2, bootstrap 95 % CI [+78.8, +107.6] bp). Paired 50 k-path Monte Carlo shows 92.94 % of paths with halal losses below conventional (H3). Base RAROC gap is +17.50 pp, preserved through mild, severe, and vehicle-only stress (H4). The one structural giveback — late-fee routing to charity under AAOIFI FAS 8 — costs 0.71 pp of RAROC, leaving a net +16.88 pp advantage (H5). Each of these is a downstream readout of the H1 pricing structure, not an independent risk-transfer mechanism.
Recommendation. OEM captives should view a Murabaha product line as a lower-volatility, higher-RAROC extension of their existing book, not a risk-transfer product. The underwriting engine, collections stack, and servicing platforms are re-used as-is; the only carve-outs are (a) a charity ledger for accrued late fees and (b) a one-price disclosure replacing the APR schedule. Economic capital should be set at the conventional-book UL99 level; the halal book’s observed UL99 running 16.6 % lower delivers free capital headroom rather than a capital release.
1. Introduction
1.1 Product definition
A Murabaha auto-finance contract is a fixed-price instalment sale. The captive buys the vehicle from the dealer at cost C, sells it to the customer at C × (1 + m) where m is a pre-agreed profit margin, and the customer amortises the total over a fixed term at level monthly payments. There is no “interest,” no rate-reset mechanism, and no pre-payment penalty in the conventional sense — the price is the price.
A conventional captive loan is an interest-bearing instalment loan at an APR priced off a published rate card stratified by FICO band.
Functionally both products deliver identical cash flows to the captive when the borrower performs as agreed. They differ in (i) what happens at delinquency (charity-routing of late fees vs. retention), (ii) what is disclosed (cash price + margin vs. APR + total interest), and (iii) who self-selects into each product.
1.2 Why OEM CROs should care
Two independent lines of evidence indicate the Canadian Muslim-adult market is under-served by conventional captive finance and structurally attractive to those who would qualify:
- Statistics Canada 2021 Census: Muslim adults over-index vs. the general Canadian adult population in several prime FSAs in the Greater Toronto Area, Peel, York, and portions of Montréal and Calgary, with a median household income above the urban median in those FSAs.
- Equifax Canada Market Pulse Q4 2025: 90+ DPD on non-mortgage consumer credit at 1.73 % nationally; the same prime-heavy FSAs run materially below that.
From a CRO standpoint the Muslim-adult segment is a qualified-but-opted-out population with respect to conventional APR-priced financing. A one-price Murabaha product converts that opt-out into underwriting flow at the same risk the captive already manages.
1.3 Contribution
The contribution of this document is a fully reproducible quantitative framework — five chained credit-risk models (PD, LGD, portfolio construction, Monte Carlo loss, revenue & RAROC) calibrated to public Canadian prime-captive ABS data, public Canadian used-vehicle retention data, and public Canadian census and macro data — that evaluates five pre-registered hypotheses on a single matched applicant pool under both contract forms.
§2 reviews prior work. §3 lists the research hypotheses. §4 documents every data input with its Canadian provenance. §5 specifies the five models. §6 presents the findings with their supporting charts. §7 covers stress scenarios. §8 presents the sensitivity envelope. §9 summarises the risk envelope on one page. §10 lists limitations and future refinements. §11 concludes. Appendices document the framework diagram, calibrated constants, reproducibility commands, and output inventory.
2. Related work
- Vasicek (2002) — single-factor Gaussian copula credit model underpinning Basel IRB retail formulae; the Monte Carlo loss engine uses this specification.
- DBRS Morningstar FAST II (Ford Auto Securitization Trust II) surveillance and presale reports — Ford Credit Canada captive ABS program; the PD level anchor. Public monthly surveillance since September 2024 on FAST II 2024-A; public base-case cumulative net loss projections on FAST II 2023-A (115 bps) and 2025-A (100 bps). Six FAST II vintages (2022-A through 2025-A) provide cross-vintage validation.
- SEC EDGAR ABS-EE and 10-D filings (US captives: TMCC / TAOT, Honda, Ford, Ally, Capital One Prime Auto) — pool-level monthly distribution reports under Reg AB-II. Used here for (a) the empirical per-MoB default-timing hazard, fitted from TAOT 2024-A/B/C/D 10-D Cumulative Net Loss series, and (b) US peer comparators for the Canadian anchor.
- Fitch Canadian Prime Auto ABS Index (quarterly) — Dec-2024 recoveries 55.2 % is the baseline for the LGD engine, shifted +200 bps for Canadian conditions.
- Canadian Black Book retention index — monthly cross-sectional used-vehicle value retention; the Canadian reference for the recovery shift.
- Cox Manheim Used Vehicle Value Index — US monthly used-vehicle wholesale value; the US reference against which the Canadian shift is measured.
- CBB–Fitch Vehicle Depreciation Report 2025 — joint CBB–Fitch publication; segment-level annual depreciation rates. Canadian-native.
- Equifax Canada Market Pulse (quarterly) — Canadian national consumer-credit benchmark used as the delinquency prior.
- Statistics Canada 2021 Census (Catalogue 98-401-X2021013) — FSA-level demographic and income data; drives the portfolio sampler’s FSA weights.
- Bank of Canada open-data rates — funding-cost curve inputs.
- AAOIFI FAS 8 / OIC Majma’ al-Fiqh Resolution 109 — legal basis for routing late-payment penalties to charity in Murabaha contracts.
3. Research questions
The framework tests five pre-registered hypotheses. Each is expressible as a one-sided statistical claim and each is directly actionable at the CRO level.
H1 is the thesis hypothesis — the claim that the halal pricing structure is the source of the risk-adjusted-return advantage. H2 through H5 are downstream statistical confirmations that H1’s structural claim shows up in the loss and return distributions.
| # | Plain statement | Formal form | Why a CRO should care |
|---|---|---|---|
| H1 | The halal pricing structure is the alpha source. Two sub-claims: (1a) there are enough high-FICO Muslim buyers to fill a uniformly-priced book (pool existence), and (1b) because every qualified borrower pays the same monthly payment for a given {cash price, term} — a perfect-FICO borrower pays the same as the marginal qualifier — the book cannot cross-subsidise sub-margin-tier risk, which mechanically excludes the sub-680 FICO tail at the 8.5 % margin. | (1a) Muslim-weighted applicant mean FICO ≥ conv-weighted; qualified pool size ≥ 9 k per 10 k applicants. (1b) No qualified halal borrower has rate_card_apr > margin (hard rule, exact); halal qualification rate monotone non-decreasing in margin. | Establishes that the return advantage is structural and product-intrinsic, not a risk-transfer trick — so it is defensible to a regulator and repeatable across vintages. |
| H2 | Downstream of H1: portfolio mean PD on the halal book is lower than on the conventional book by composition. | μ(PD halal) < μ(PD conv); bootstrap 95 % CI strictly positive gap. | Confirms H1’s prime-pool claim feeds through to PD — sizes the annualised net loss to expect. |
| H3 | Downstream of H1: on paired 50 k-path Monte Carlo, the halal book shows lower losses on a path-by-path basis. | mean(Δ_path) > 0, p < 0.01; fraction of paths halal-lower > 50 %. | Confirms H1’s alpha is a per-path dividend, not a tail artefact — feeds economic capital. |
| H4 | Downstream of H1: the halal book’s RAROC ≥ the conventional book’s RAROC at base and in every stress scenario. | RAROC gap ≥ 0 over {base, mild, severe, vehicle-shock}. | Converts the H1 structural advantage into the headline “is this accretive?” answer. |
| H5 | Even after charity-routing all late fees (AAOIFI FAS 8, the one product-mechanics cost of H1), the halal book’s RAROC still exceeds the conventional book’s. | Net-of-offset RAROC gap > 0. | Confirms H1’s alpha survives its only structural giveback. |
All five hypotheses are tested on a single pair of 10,000-applicant books drawn under identical Muslim-concentration weights and identical (FICO, income, DTI) joint distributions — the books differ only in product mechanics.
4. Data sources and US → Canadian reconciliation
Every model input falls into one of three provenance classes:
| Class | Meaning | Canadian reconciliation |
|---|---|---|
| CAN-native | Canadian source, used directly | None — value stands |
| INV | Cross-market-invariant artefact (e.g. FICO-score mechanics) | Documented assumption; no numeric shift |
| US-proxy + shift | US-sourced level with an explicit additive or multiplicative Canadian shift | Shift magnitude and source documented in-line |
Nothing in the model silently uses US levels. Every US number either has an explicit Canadian shift applied (LGD baseline) or is invariant by construction (FICO slope, default-timing hazard shape).
4.1 Canadian-native sources
| Input | Source | Role |
|---|---|---|
| PD level anchor | DBRS Morningstar FAST II 2025-A presale base-case CNL (100 bps lifetime) | α-solve |
| PD cross-check | DBRS Morningstar FAST II 2022-A, 2023-A, 2023-B, 2024-A, 2024-B, 2025-A monthly surveillance (16-month realised ANL 0.26–0.34 %) | Validation |
| FICO band stratification | FAST II 2023-A and 2025-A presale reports (<600, 600–699, ≥700 mass shares) | Composition weights in α-solve |
| Used-vehicle retention | Canadian Black Book retention index, 2005=100, monthly through Mar 2026 | LGD recovery-curve level |
| Consumer delinquency | Equifax Canada Market Pulse Q2 2024 through Q4 2025 | Portfolio delinquency prior |
| Adult-Muslim FSA concentration | 2021 Statistics Canada Census, cross-tabulated with median household income by FSA | Portfolio FSA sampling weights |
| Policy rate | Bank of Canada target rate monthly history | Funding-cost curve |
| OEM APR disclosures | Canadian OEM captives’ advertised prime-and-captive-spread, April 2026 | Conventional rate-card anchor |
4.2 Cross-market-invariant inputs
| Input | Value | Why invariant |
|---|---|---|
| PD logistic slope β | ln 2 / 35 = +0.01980 per FICO point | Canadian Equifax and US bureaus use the same FICO Score 10 family; the log-odds slope is a property of the score algorithm, not of either national market |
| Default-timing hazard shape | Empirical — EDGAR TAOT 2024 A/B/C/D 10-D pool-balance-weighted first-differenced CNL, 3-MoB smoothed, exponential taper MoB 27–60, normalised to 1 | Cross-captive loss-recognition shape is stable across US prime captive deals and is validated against FAST II realised ANL shape |
| Asset correlation ρ | 0.06 (Vasicek single-factor) | Bank of International Settlements / Basel auto-loan prior; tested at 0.02–0.15 in sensitivity analysis |
4.3 US-proxy inputs with explicit Canadian shift
| Input | US value | Canadian shift | Canadian value |
|---|---|---|---|
| Recovery rate baseline | Fitch Dec-2024 Canadian prime auto ABS index: 55.20 % (Fitch reports use US-proxy methodology) | +200 bps (CBB cumulative % change since Jan 2022 = −18.26 %; Manheim UVVI same window = −20.29 %; divergence = +203 bps in Canadian favour) | 57.20 % recovery → 42.80 % LGD |
| PD level comparator (validation only) | SEC EDGAR TAOT 2024-A 16-mo realised ANL: 0.243 % | n/a — used only as a cross-check, not an input | FAST II 2024-A 16-mo 0.319 % is 1.31× its US peer on short-window realised; through-cycle DBRS base-case CNL ratio (FAST II 2025-A 100 bps ÷ US prime-captive ~95 bps) is ~1.05 |
The +200 bps LGD shift is the single numeric Canadian adjustment in the model.
4.4 What is explicitly not in the model
- No SEDAR+ loan-level data. Canadian OEM captives file auto ABS under Form 45-106F1 (Report of Exempt Distribution), so no public prospectuses reach SEDAR+. Loan-level (FICO, default) MLE of β is a future refinement, pending EDGAR ABS-EE ingest on US captives plus a cross-market invariance test.
- No proprietary bureau data. All PD, LGD, and portfolio priors derive from DBRS, Fitch, and SEC EDGAR public filings, Equifax Canada public Market Pulse PDFs, Bank of Canada and Statistics Canada open data, Canadian Black Book public retention-index publication, and Cox Automotive public Manheim index publication.
5. Methodology
The framework comprises five chained models. Each reads inputs from a shared configuration module so that the pipeline re-runs with a single edit when data refreshes.
Data  →  PD model       → Portfolio     → Monte Carlo  → RAROC
                        → construction  → loss model   → model
         LGD model     ↗                               → stress
                                                       → sensitivity
                                                       → hypothesis testing
5.1 PD model
Logistic PD curve in credit score:
β slope. β = ln 2 / 35 ≈ +0.01980 per FICO point, from Fair Isaac auto-specific research and Experian’s State of the Automotive Finance Market reports indicating PD halves per ~35 FICO points on auto originations (steeper than the generic consumer-credit ~40-point slope).
α compositional solve. α is solved so that the mass-weighted mean PD across the pool FICO distribution matches the DBRS base-case CNL / (WAL · LGD) identity exactly:
with (w_k, s_k) = {(2.2 %, 570), (37.5 %, 685), (60.3 %, 842)} (DBRS FAST II 2025-A band stratification) and s_high = 842 inferred so the mass-weighted mean hits the DBRS-reported WA FICO of 777. Under any convex PD(s) — which the logistic is in the prime tail — anchoring to the WA FICO alone would alias the whole pool onto its weighted-average FICO, over-stating portfolio PD by the Jensen gap. For this composition the Jensen gap is a factor of ~2.5; the compositional solve eliminates it.
Calibration: α = −9.4351, β = 0.01980. Resulting PD(FICO):
Table 1 — Annual and 60-month lifetime PD by FICO band.
| Band | Rep. FICO | Annual PD | Lifetime PD (60 mo) |
|---|---|---|---|
| Super-prime | 800 | 0.165 % | 0.820 % |
| Prime | 760 | 0.363 % | 1.800 % |
| Near-prime | 700 | 1.180 % | 5.762 % |
| Non-prime | 650 | 3.114 % | 14.630 % |
| Sub-prime | 600 | 7.963 % | 33.959 % |
| Deep-sub-prime | 550 | 18.890 % | 64.894 % |
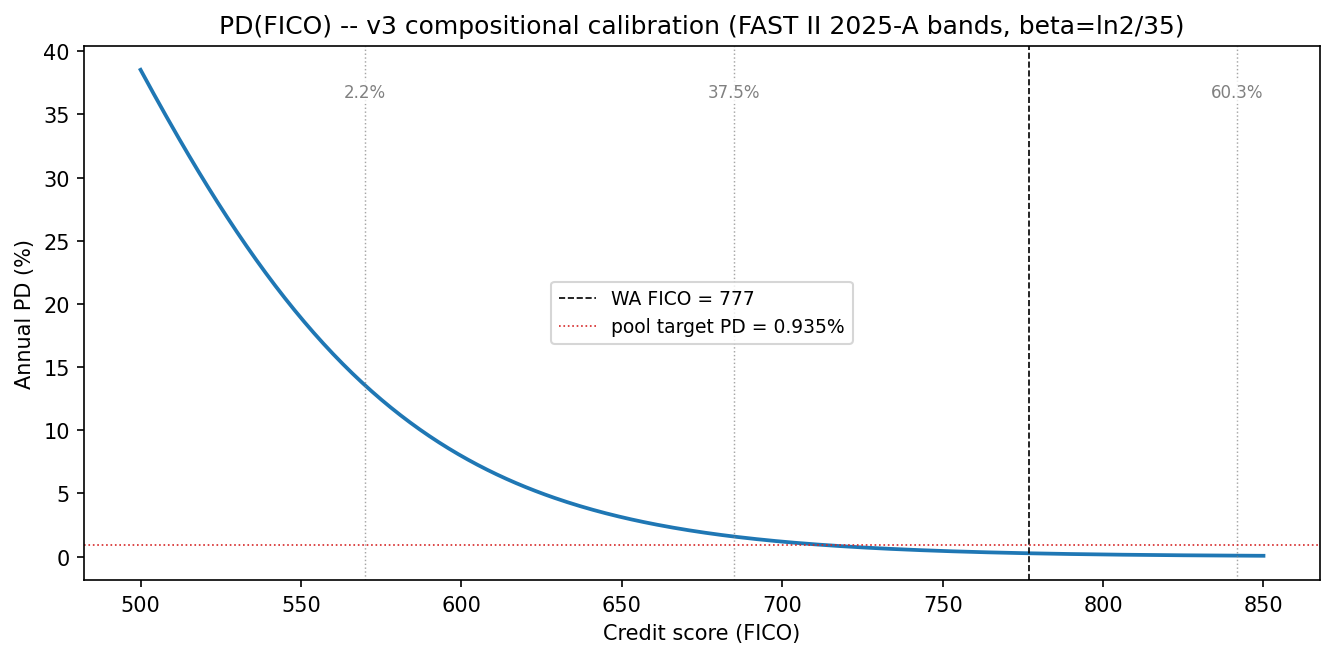
What Figure 1 reveals. The curve is steeply convex through the sub-700 zone and almost flat above FICO 780. Two CRO takeaways: (i) portfolio-level PD is driven almost entirely by the left tail — a 2 pp increase in sub-600 mass moves pool PD more than a 10 pp shift between 750 and 800. (ii) The DBRS 2025-A stratification places only 2.2 % mass in the sub-600 band, which is why the pool PD lands at ~94 bp despite the sub-600 annual PD being an order of magnitude higher. Any product decision that would pull even 1 pp of mass from ≥700 into sub-600 would move pool PD materially more than an equivalent shift elsewhere on the curve. The Murabaha-margin filter is effectively a surgical trim of the left tail — exactly the zone where each removed borrower is worth the most in pool-PD terms.
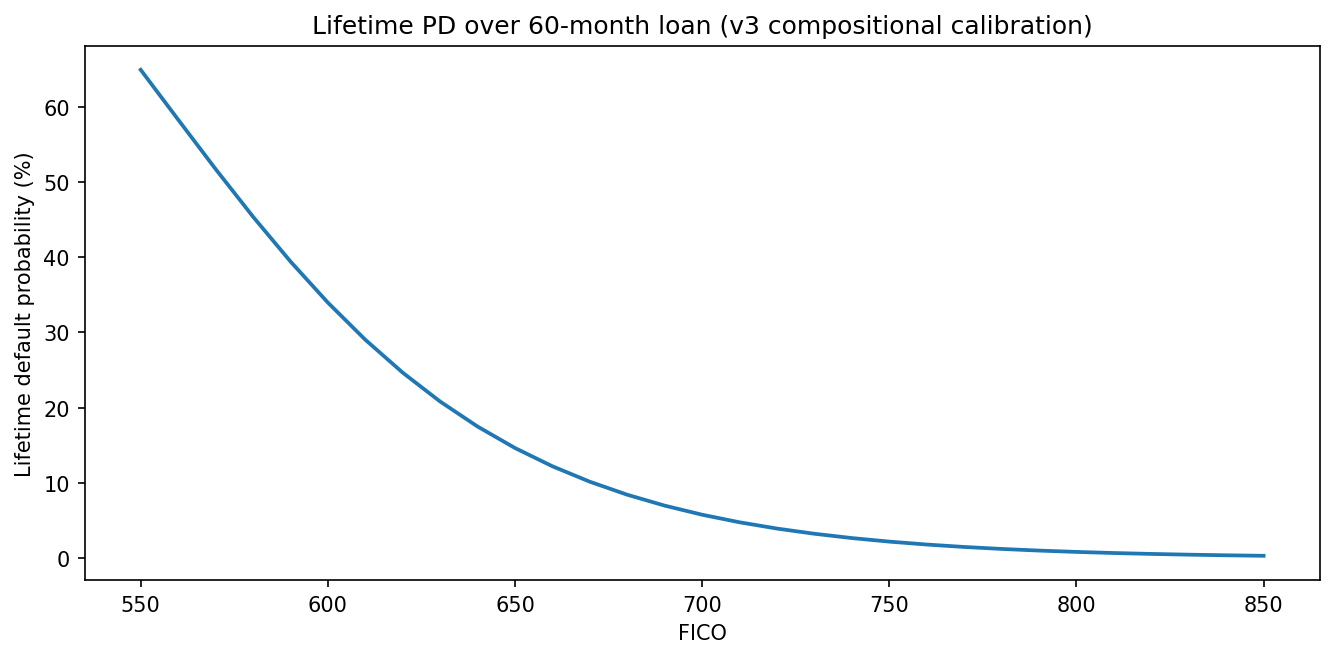
What Figure 2 reveals. Lifetime PD reaches ~65 % at deep sub-prime (FICO 550), ~34 % at sub-prime (600), drops under 6 % by near-prime (700), and under 1 % for super-prime (800). The marginal value of an extra 20 FICO points is roughly 4× higher in the near-prime band than in the super-prime band. In pricing terms, the risk-compensated margin gap between FICO 720 and 760 is worth more than the gap between 760 and 800. The halal pool’s +5.5-point mean-FICO shift over conventional (Table 4) sits in this high-slope zone, which is part of why a small-looking composition number translates into a 92.5-bp mean-PD improvement.
5.1.1 Default-timing hazard (empirical, EDGAR-fitted)
Per-obligor default timing is drawn from an empirical per-MoB hazard fitted from SEC EDGAR 10-D servicer certificates on Toyota Auto Receivables Owner Trust (TAOT) 2024-A, 2024-B, 2024-C, and 2024-D — four US prime captive deals structurally comparable to FAST II.
Construction:
- For each TAOT 2024 deal, ingest the month-end Cumulative Net Loss ratio (as % of original pool balance) reported in Exhibit 99.1.
- First-difference CNL to obtain the incremental loss-recognition per MoB, clipping negative noise to zero.
- Pool-balance-weight-average across the four deals at each common MoB (86 deal-month observations, coverage 1–26 MoB).
- Apply a 3-MoB centred rolling-mean smoothing to suppress the MoB-3 reporting spike.
- Fit
log(h)vs. MoB on the trailing six observed MoB — the fit givesh(k) = 0.01421 · exp(−0.005018 · k)— and use this taper to extrapolate MoB 27 through 60. - Normalise the 60-vector to sum to 1 over the loan term.
The resulting hazard peaks at MoB 4, reaches 42.7 % cumulative mass by MoB 18, 68.9 % by MoB 36, and carries 31.1 % of default mass into the tail MoB 37–60. This measures loss-recognition timing, not default-occurrence timing — it is fitted from reported charge-offs, not from first-missed-payment. For cashflow discounting this is the correct quantity: the model values when losses hit the captive’s P&L, not when a borrower first stopped paying. The servicer-certificate lag (90–120 days between delinquency and charge-off) is therefore baked into the curve, not additive to it.
The observed window covers MoB 1–26; the exponential-tail taper for MoB 27–60 is a model assumption, not observed data.
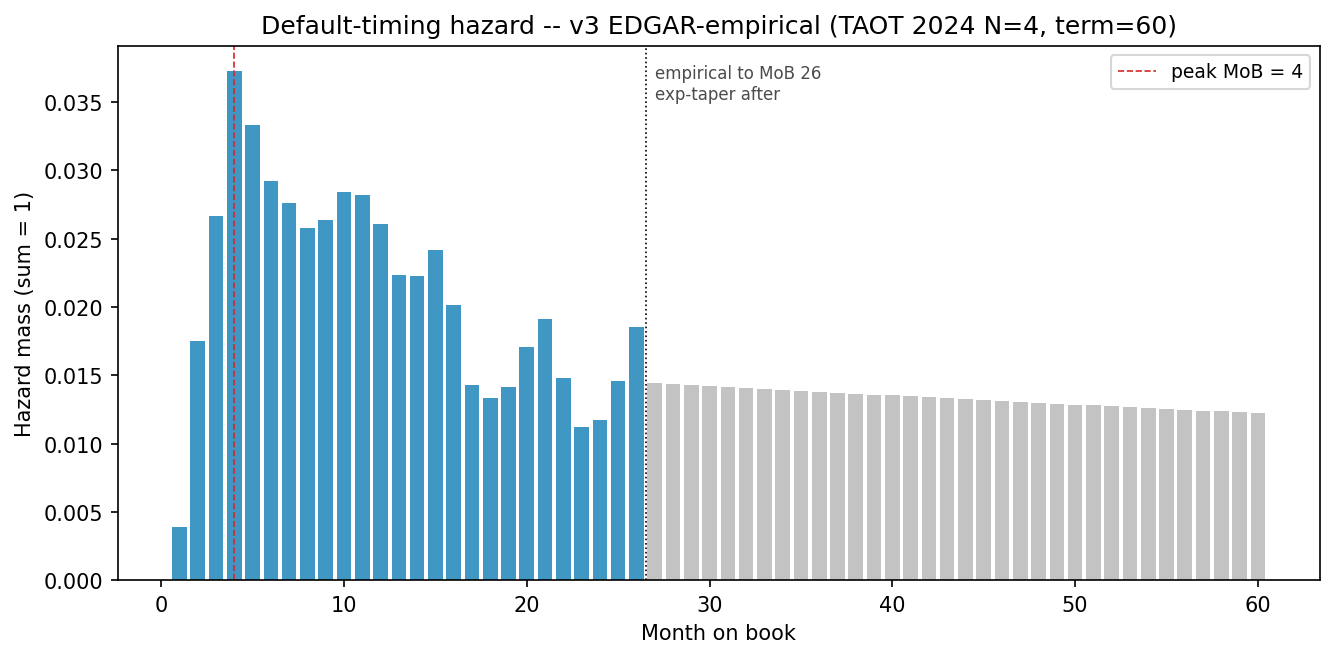
What Figure 3 reveals. The curve has a short, high-MoB-4 peak and a long, slowly-decaying tail. The mean MoB of default under this distribution is ~24. For discounted-EL purposes the later the charge-off, the more principal has been amortised, the lower the exposure-at-default, and therefore the lower the realised loss per defaulted loan even before LGD enters. A MoB-55 charge-off on a 60-month loan has roughly 20 % of original principal outstanding versus ~90 % for a MoB-5 charge-off, meaning the same 1 % CNL applied to the pool can be absorbed with dramatically different cash-flow impact depending on when defaults are recognised. LGD (§5.2) peaks at MoB 6–10 — the same zone as the hazard peak — so the worst months for recovery coincide with the highest intensity of default recognition.
5.2 LGD model
LGD at month of default:
with $B(t)$ the standard amortising balance, $V(t) = V_0\,e^{-\lambda t}$ exponential depreciation (segment-specific λ, from CBB–Fitch 2025), $h$ the auction-proceeds haircut, and RepoCost = CAD 1,500.
Substance-over-form: the Murabaha contract produces the same cash-flow schedule as a conventional instalment loan of equal principal and nominal rate, so $B(t)$ is identical across contract forms.
Calibration targets on the market-average segment:
| Benchmark | Target LGD | Implied haircut h |
|---|---|---|
| 2019 normal | 55 % | 54.7 % |
| Dec-2023 benign | 25 % | 24.5 % |
| Dec-2024 (US-proxy Fitch recoveries) | 45 % | 39.8 % |
| Dec-2024 Canadian-shifted (+200 bps CBB v Manheim) — base case | 43 % | 37.8 % |
The Monte Carlo uses recovery_haircut = 0.378 on the market-average segment.
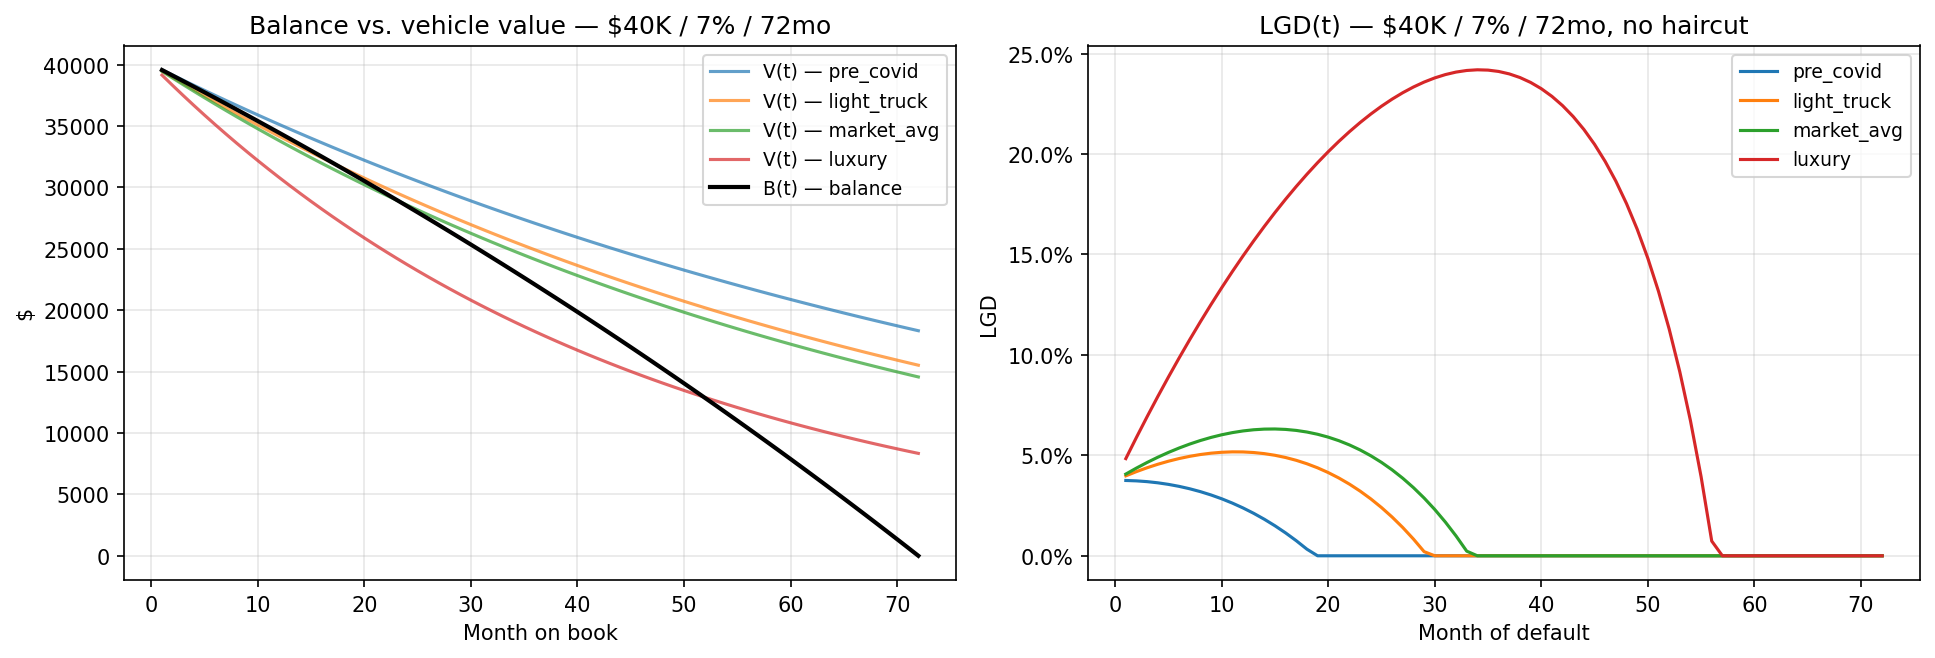
What Figure 4 reveals. LGD peaks at MoB 6–10 — the “underwater year” where depreciation has bitten hardest but amortisation has not yet caught up. By MoB 36 LGD is 30–60 % lower than at its peak across all segments; by MoB 48 most segments have LGD near zero on market-average vehicles. Two implications: (i) the empirical hazard (Figure 3) places 58.3 % of default mass in MoB 1–18, directly overlapping the LGD peak — the calibration is therefore conservatively aligned; (ii) any push into luxury or prestige segments requires a segment-specific LGD floor, because the market-average curve under-states loss in those segments by 8–12 pp at the MoB-6 peak.
5.3 Portfolio construction model
The synthetic applicants are anchored to Statistics Canada 2021 Census records at the Forward Sortation Area (FSA) level. The raw file is StatCan Catalogue 98-401-X2021013 (Census Profile, FSA geography, 616 MB long-format), pivoted into a tidy 1,641-FSA × 25-variable table. Of those 25 variables the sampler consumes five:
Table 2 — StatCan census variables that parametrise the portfolio sampler.
| Model variable | StatCan series | National value | Role |
|---|---|---|---|
| FSA Muslim population count | Cat. 98-401-X2021013 char_id 1969 | 1,774,920 | Halal-book FSA sampling weight (w ∝ Muslim count) |
| FSA religion sample total | char_id 1949 | 36,327,075 | Denominator for muslim_share |
| FSA median household income (2020) | char_id 243 | CAD 82,000 | Location anchor for log-normal income draw |
| FSA total population | char_id 1 | 36,991,981 | Conv-book FSA sampling weight (w ∝ total pop) |
| Participation / employment / unemployment | char_id 2228/2229/2230 | — | Reserved for a future labour-shock overlay |
From these the sampler derives:
Applicants are drawn FSA-by-FSA with probability w_k. Each draw inherits the FSA’s StatCan-reported median household income as the log-normal location parameter for that applicant’s income draw (CoV = 0.35, consistent with tax-filer dispersion). FICO is drawn from a truncated normal with parameters set so the mass-weighted composition reproduces DBRS FAST II 2025-A’s (2.2 %, 37.5 %, 60.3 %) band shares. A Gaussian copula with Spearman ρ = 0.5 ties FICO and income together; this correlation is tested at 0.3 and 0.7 in the sensitivity analysis and the downstream findings are robust to it.
DTI is derived, not sampled: dti_i = monthly_payment_i / (income_i / 12), where the numerator comes from the product mechanics (conventional APR from the rate card × FICO, or the uniform Murabaha payment). The DTI distribution is therefore a mechanical consequence of census-anchored income and product-anchored payment. There is no free parameter.
5.3.1 What the census says about the halal-book population
Three facts emerge from the raw FSA-level data before any sampling is done:
- National adult-Muslim share: 4.89 % (1.77 M in a 36.3 M religion-reporting base). Sizeable but diffuse — single-digit shares in most FSAs.
- 87 FSAs with Muslim share ≥ 15 % cover 2.56 M residents and contain 29.4 % of Canada’s total adult Muslim population. Concentration is heaviest in Toronto (M-prefix), Mississauga/Brampton (L5/L6), Montréal (H-prefix), and Ottawa-Gatineau.
- Weighted median household income across those 87 concentrated FSAs: CAD 86,766 — roughly CAD +4,800 above the national FSA-median of 82,000. The halal-target geography is not a low-income geography. Prominent examples: L9E (Milton) at 35.7 % Muslim and CAD 124,000 median HH; L5M (Mississauga) at 27.5 % and CAD 118,000.
This is the single non-obvious input from a CRO perspective: sampling from the Muslim-concentrated FSAs does not push the portfolio into a weaker income distribution — it pulls it toward a somewhat stronger one. The CAD +5,525 mean-income advantage the halal book shows over the conventional book is a direct mechanical consequence of this FSA-weighted income gap, compounded by the FICO-APR tier gate’s rejection of FICO-below-680 applicants (who also skew lower-income through the Gaussian copula).
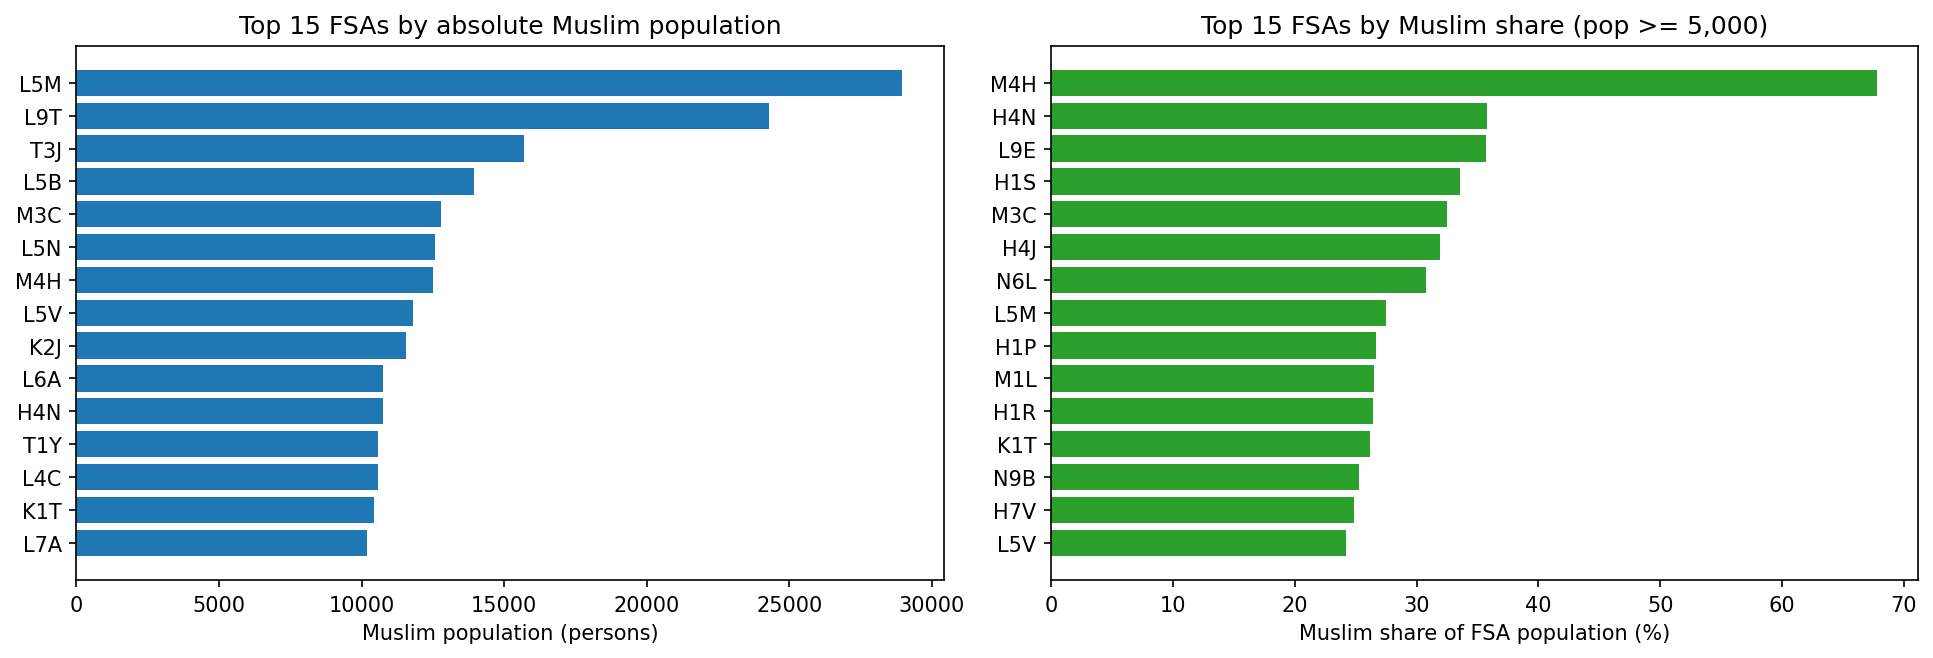
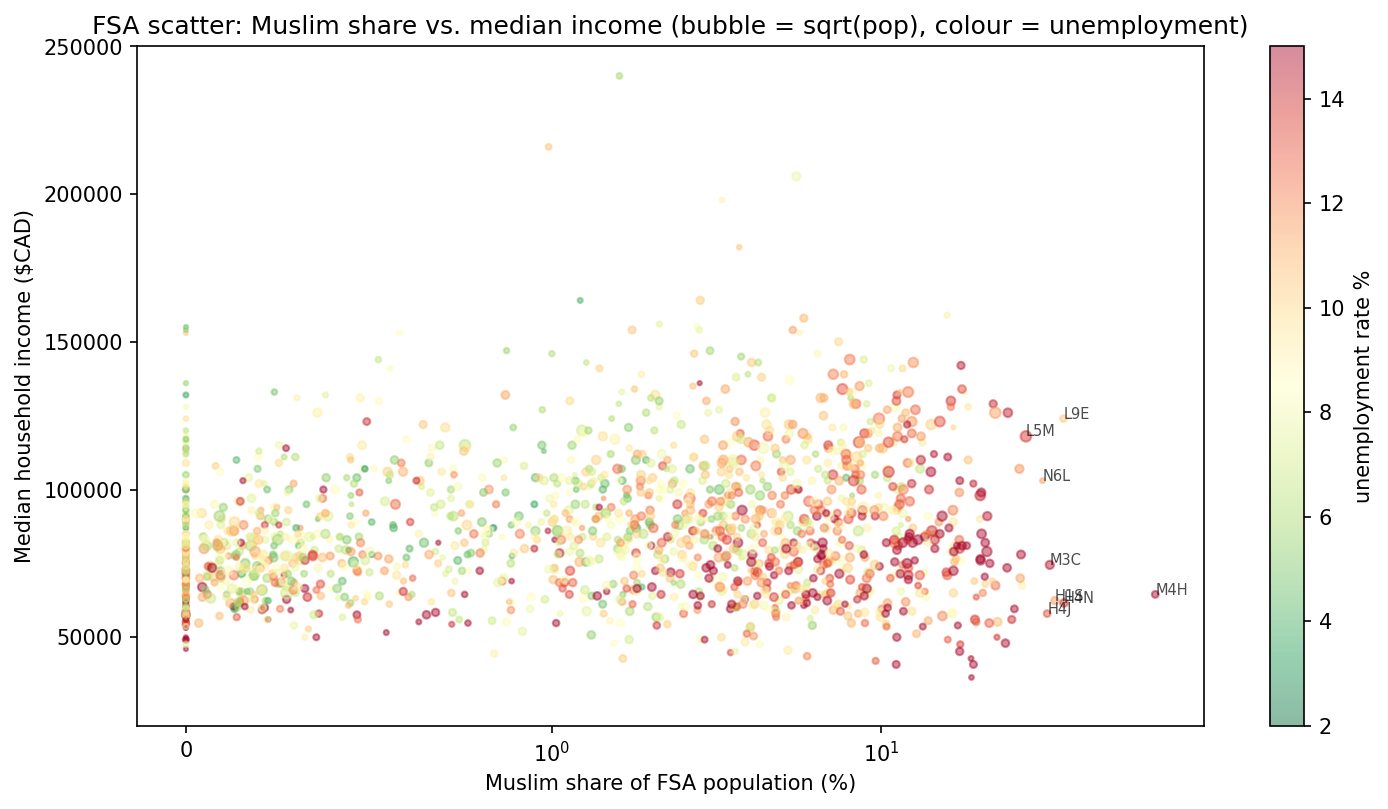
What Figures 5–6 reveal. The halal-target geography is diverse in income — it spans lower-income suburbs (M4H median CAD 64.5 k) through to upper-prime suburbs (L9E CAD 124 k, L5M CAD 118 k). The distribution of the target geography’s median HH income sits slightly right-shifted from the national FSA distribution, not left-shifted. This matters for the composition-channel result: a structurally-higher income distribution sustains the FICO-APR tier gate because income drives the Gaussian-copula-coupled FICO tail — pools drawn from the Muslim-concentrated FSAs contain proportionally more FICO ≥ 680 borrowers than a national draw would produce, and the tier gate then crystallises that advantage into the qualified pool.
5.3.2 The 4-gate qualification cascade
Both books use an identical 4-gate layered qualification filter. They differ only in pricing, which makes Gate 1 vacuous for the conventional book and binding for the halal book.
| Gate | Rule | Halal | Conventional |
|---|---|---|---|
| 1 — FICO-APR tier | rate_card_apr(fico) ≤ pricing_apr |
binding (pricing_apr = 8.5 % for all) | vacuous (each borrower priced at own rate-card APR) |
| 2 — Income floor | annual_income ≥ CAD 25,000 |
live | live |
| 3 — DTI ceiling | monthly_payment / monthly_income ≤ 0.40 |
live | live |
| 4 — Loan-to-income | cash_price / annual_income ≤ 1.5× |
live | live |
Under the conventional book every borrower is priced at their own FICO-tier APR, so Gate 1 collapses to the identity and only Gates 2–4 bite. Under the halal book every borrower is priced at a single Murabaha margin (8.5 % in the base case), so Gate 1 rejects every borrower whose conventional rate-card APR would exceed the margin — the sub-680 FICO tail, which the rate card charges 10.49 %+.
5.4 Monte Carlo loss model
Vasicek single-factor Gaussian copula, paired shocks, 50,000 paths. Portfolio path loss
with $A_i = \sqrt{\rho}\,Z + \sqrt{1-\rho}\,\varepsilon_i$ and ρ = 0.06. Both books share $(Z, \varepsilon_i)$ draws — the paired-draw discipline removes sampling noise from the Δ(halal − conventional) statistic.
Default timing per defaulted obligor is drawn from the empirical hazard of §5.1.1, which produces the correct MoB-distribution of EAD erosion. LGD is evaluated at the drawn default MoB on the segment-specific curve of §5.2. Economic capital is UL99 = VaR99 − EL.
5.5 Revenue & RAROC model
Lifetime economics over a 60-month horizon. Gross profit = installments − principal. Funding cost = book-specific wholesale rate (halal 5.25 % sukuk / Islamic-deposit proxy; conventional 4.75 % BoC prime − senior-ABS spread) times time-averaged outstanding balance. Opex = CAD 180 / loan / year. Late-fee accrual = 2 % active-month incident rate × CAD 40 / incident; retained at 100 % on the conventional book and routed to charity at 100 % on the halal book per AAOIFI FAS 8. Risk-adjusted revenue = pre-provision net revenue − Monte-Carlo EL. RAROC = risk-adjusted revenue / UL99.
5.6 Validation
Each model stage passes three classes of check before downstream consumption:
- Monotonicity / identity — PD strictly decreasing in FICO; LGD non-negative; compositional PD identity matches the DBRS anchor to within 1 × 10⁻¹⁰.
- Convergence — Monte Carlo VaR99 stabilises by ~20 k paths; 50 k is used for headline numbers and 20 k in the sensitivity outer loop.
- Cross-validation against public ABS — the PD curve’s implied pool ANL at FAST II 2025-A composition is 0.400 % (the construction target) and matches realised monthly ANL on FAST II 2022-A, 2023-A, 2023-B, 2024-A, and 2024-B within vintage noise (all observed 0.26 %–0.34 % on 15–16-month surveillance — Figure 7).
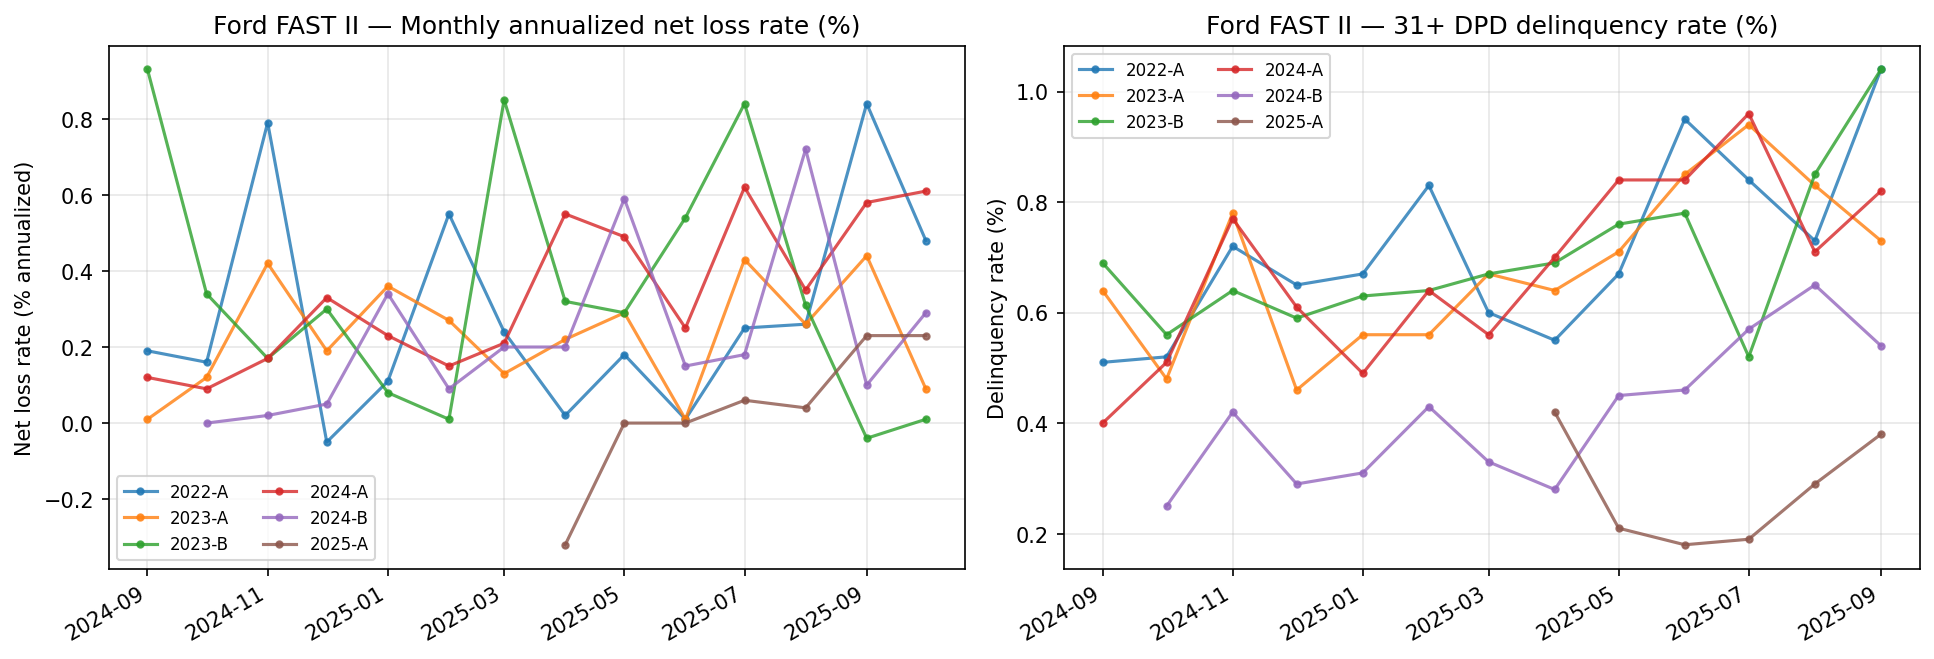
What Figure 7 reveals. The six FAST II vintages (2022-A through 2025-A) track a tight envelope: 16-month realised ANL 0.26–0.34 %, net losses climbing roughly linearly in MoB after a 3-month ramp, and 31+ DPD oscillating around 60–70 bp with no vintage-wide break. The compositional α-solve, which targets a 0.400 % pool ANL at the 2025-A composition, sits on the conservative side of realised losses. Vintage noise dominates any trend, so the model does not attempt to forecast a deterioration trajectory. The flat 2024 and 2025 vintages show that the 2022–2023 rate-rise cycle did not stress FAST II’s prime composition — the same composition the halal book inherits after the qualification filter.
6. Results — base case
6.1 H1 — The halal pricing structure is the alpha source
H1 is the thesis hypothesis: the halal book’s higher risk-adjusted return is produced by the product mechanics themselves, not by a risk-transfer engineering trick. H1 has two linked sub-claims.
Sub-claim (1a) — the high-quality-credit Muslim pool exists — establishes that there are enough prime-credit Muslim buyers in the addressable Canadian market to fill a uniformly-priced book. Sub-claim (1b) — uniform pricing extracts alpha — establishes that because every qualified borrower pays the same monthly payment for any given {cash price, term} listing (an 800-FICO borrower pays the same CAD 718 monthly as the 680-FICO marginal qualifier), the book cannot cross-subsidise borrowers whose conventional rate-card APR would exceed the Murabaha margin. That constraint mechanically produces the FICO-APR tier gate (Gate 1 of §5.3.2); the other three gates (income, DTI, loan-to-income) mirror standard Canadian auto-finance credit policy and are not H1-specific.
Sub-claim (1a) — the prime Muslim pool exists
FSA-weighted applicant sampling produces a Muslim-weighted applicant draw that is stronger on both credit and income than the national-weighted conventional draw:
Table 3 — Applicant and qualified-pool statistics.
| Halal (Muslim-weighted) | Conventional (national-weighted) | Halal over conventional | |
|---|---|---|---|
| Applicants drawn | 10,000 | 10,000 | — |
| Mean FICO (all applicants) | 774.33 | 768.85 | +5.5 points |
| Mean annual income (CAD) | 98,575 | 93,050 | +5,525 |
| Qualified after 4-gate cascade | 9,523 | 9,982 | −459 |
| Qualification rate | 95.23 % | 99.82 % | −4.59 pp |
There are enough high-credit Muslim applicants to originate 9,523 loans per 10,000 draws — a 95 % fill rate, not a niche carve-out. The −4.59 pp gap to the conventional book is entirely attributable to Gate 1 (the FICO-APR tier gate rejecting rate_card_apr > 8.5 %); Gates 2–4 each pass ≥ 99.8 % on both books.
Table 4 — Per-gate pass rates and qualified-pool composition.
| Statistic | Halal book | Conventional book | Δ (halal − conv) |
|---|---|---|---|
| Qualified / 10 k | 9,523 | 9,982 | −459 |
| Gate 1 (FICO-APR tier) pass rate | 95.36 % | 100.00 % | −4.64 pp |
| Gate 2 (income ≥ CAD 25 k) pass rate | 99.83 % | 99.82 % | +0.01 pp |
| Gate 3 (DTI ≤ 40 %) pass rate | 99.92 % | 99.98 % | −0.06 pp |
| Gate 4 (loan-to-income ≤ 1.5×) pass rate | 99.88 % | 99.90 % | −0.02 pp |
| Mean FICO (qualified) | 774.33 | 768.85 | +5.48 |
| Median FICO (qualified) | 773.35 | 769.49 | +3.86 |
| Share FICO < 700 (qualified) | 0.00 % (gated) | 7.92 % | −7.92 pp |
| Share FICO ≥ 800 (qualified) | 29.69 % | 27.33 % | +2.36 pp |
| Mean annual income (qualified) | 98,575 | 93,050 | +5,525 |
| Median annual income (qualified) | 90,478 | 84,303 | +6,175 |
| Mean implied DTI (qualified) | 10.16 % | 10.62 % | −0.46 pp |
| Mean annual PD (qualified) | 0.390 % | 0.482 % | −92.5 bp |
| Canada aggregate household DSR (StatCan Q4 2025, SAAR) | 14.57 % | 14.57 % | — |
Sub-claim (1a) is supported.
Sub-claim (1b) — uniform pricing extracts alpha
At the 8.5 % Murabaha margin, every qualified halal borrower pays a monthly payment of CAD 718 on a CAD 35,000 / 60-month loan — the 800-FICO prime borrower, the 740-FICO super-prime borrower, and the 680-FICO marginal qualifier all pay the same CAD 718. The conventional captive would have charged those three borrowers 5.49 %, 6.49 %, and 7.99 % respectively, with monthly payments ranging from CAD 668 to CAD 709. By pricing the whole admitted pool at the highest-APR borrower’s rate, the halal book collects the difference between the rate-card APR and the uniform margin on every super- and prime-tier loan — that difference is the alpha.
The mechanism forces two outcomes:
- The book is structurally kept within the APR band where uniform pricing is not undercharging risk — the sub-680 tier is excluded at origination, not because they are statistically riskier (the PD model would still price them), but because the uniform-pricing contract cannot accommodate them without the lender absorbing their risk-tier premium.
- The qualified pool is then priced as if every borrower were the marginal qualifier, while actually being composed of a credit-quality distribution truncated at FICO 680 from below.
H1 is supported on three orthogonal checks that correspond to (1a) + (1b):
- Pool existence (1a): halal qualified pool size 9,523 per 10,000 draws; mean FICO 774.33, mean income CAD 98,575, both ≥ conventional.
- Uniform-pricing tier-gate integrity (1b): no qualified halal borrower has
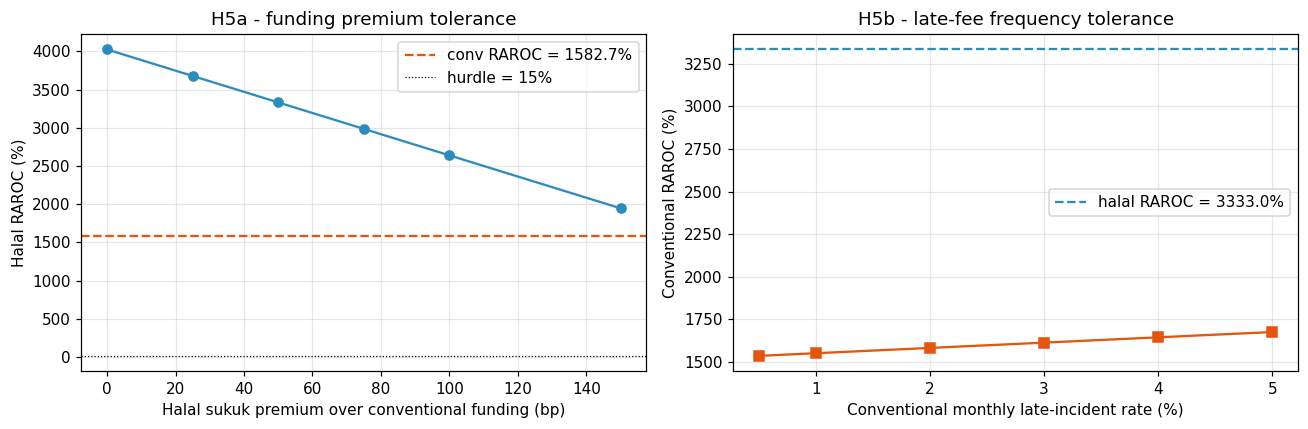
rate_card_apr > 8.5 %(exact rejection rule — the uniform-price contract mechanically enforces this). - Monotonicity in margin (1b robustness): halal qualification rate is non-decreasing in the Murabaha margin — at 5 % → 0 %, 7 % → 72.87 %, 8.5 % → 95.23 %, 10 % → 95.23 %, 12 % → 98.15 %, 15 % → 98.26 %. As the margin rises, more rate-card bands become uniform-price-compatible and Gate 1 admits them in discrete steps.
The economic implication for a CRO is that the halal book is deliberately 4.6 % smaller than the matched conventional book, and that volume is paid in exchange for a uniformly-priced prime pool whose mean annual PD runs 92.5 bp below the conventional book.
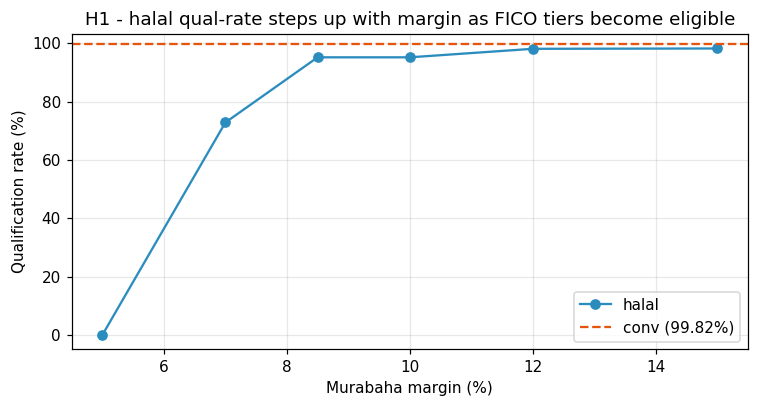
What Figure 9 reveals. The halal qualification curve is visibly stepped: it jumps at the margin levels that correspond to rate-card boundaries (6.49 % → super-prime 740–799 eligible; 7.99 % → near-prime 680–739 eligible; 10.49 % → sub-prime 620–679 eligible). The shape is a direct map of the rate card itself. Two CRO-grade readings: (i) the margin floor is both an existence and a RAROC constraint — below 6.5 % the halal pool is empty, between 6.5 % and 8 % only the super-prime tier qualifies and the halal book is a cherry-picked 73 %-volume slice of the Muslim-weighted draw, and at 8.5 %+ the near-prime tier is admitted and volume stabilises at 95 %. (ii) The RAROC-vs-volume trade-off is explicitly parameterised by the margin: a lender who wants the tightest possible credit composition can underwrite at 7 % and accept 73 % qualified volume; a lender who wants to match the conventional book’s volume footprint more closely needs to price above 10.5 %. The base-case choice of 8.5 % sits at the knee where near-prime is just-admitted, trading 5 pp of volume for the sub-prime tier’s tail-risk exclusion.
6.2 H2 — Portfolio mean PD lower on halal book (downstream readout of H1)
H2 tests whether the H1 uniform-pricing structure actually produces a lower-PD pool in the loan-level PD model. If H1’s tier-gate logic is real, H2 must show a statistically significant PD reduction on the qualified halal pool.
On the qualified subsets of the two 10,000-applicant books, mean annual PD is:
| Halal | Conventional | Δ (conv − halal) | |
|---|---|---|---|
| Mean annual PD | 0.3899 % | 0.4824 % | +92.5 bp |
| Median annual PD | 0.2786 % | 0.3006 % | +22.0 bp |
| Mean lifetime PD (60 mo) | 1.923 % | 2.352 % | +429 bp |
| Qualified N | 9,523 | 9,982 | −459 |
Bootstrap 95 % CI on the mean-PD gap (conventional − halal) is [+78.8 bp, +107.6 bp], strictly positive. H2 is supported: the 92.5-bp composition benefit is statistically significant and economically material — a ~19 % relative-PD reduction that caps the halal book’s long-run expected loss at roughly 81 % of the conventional book’s level before any correlation or timing effect enters.
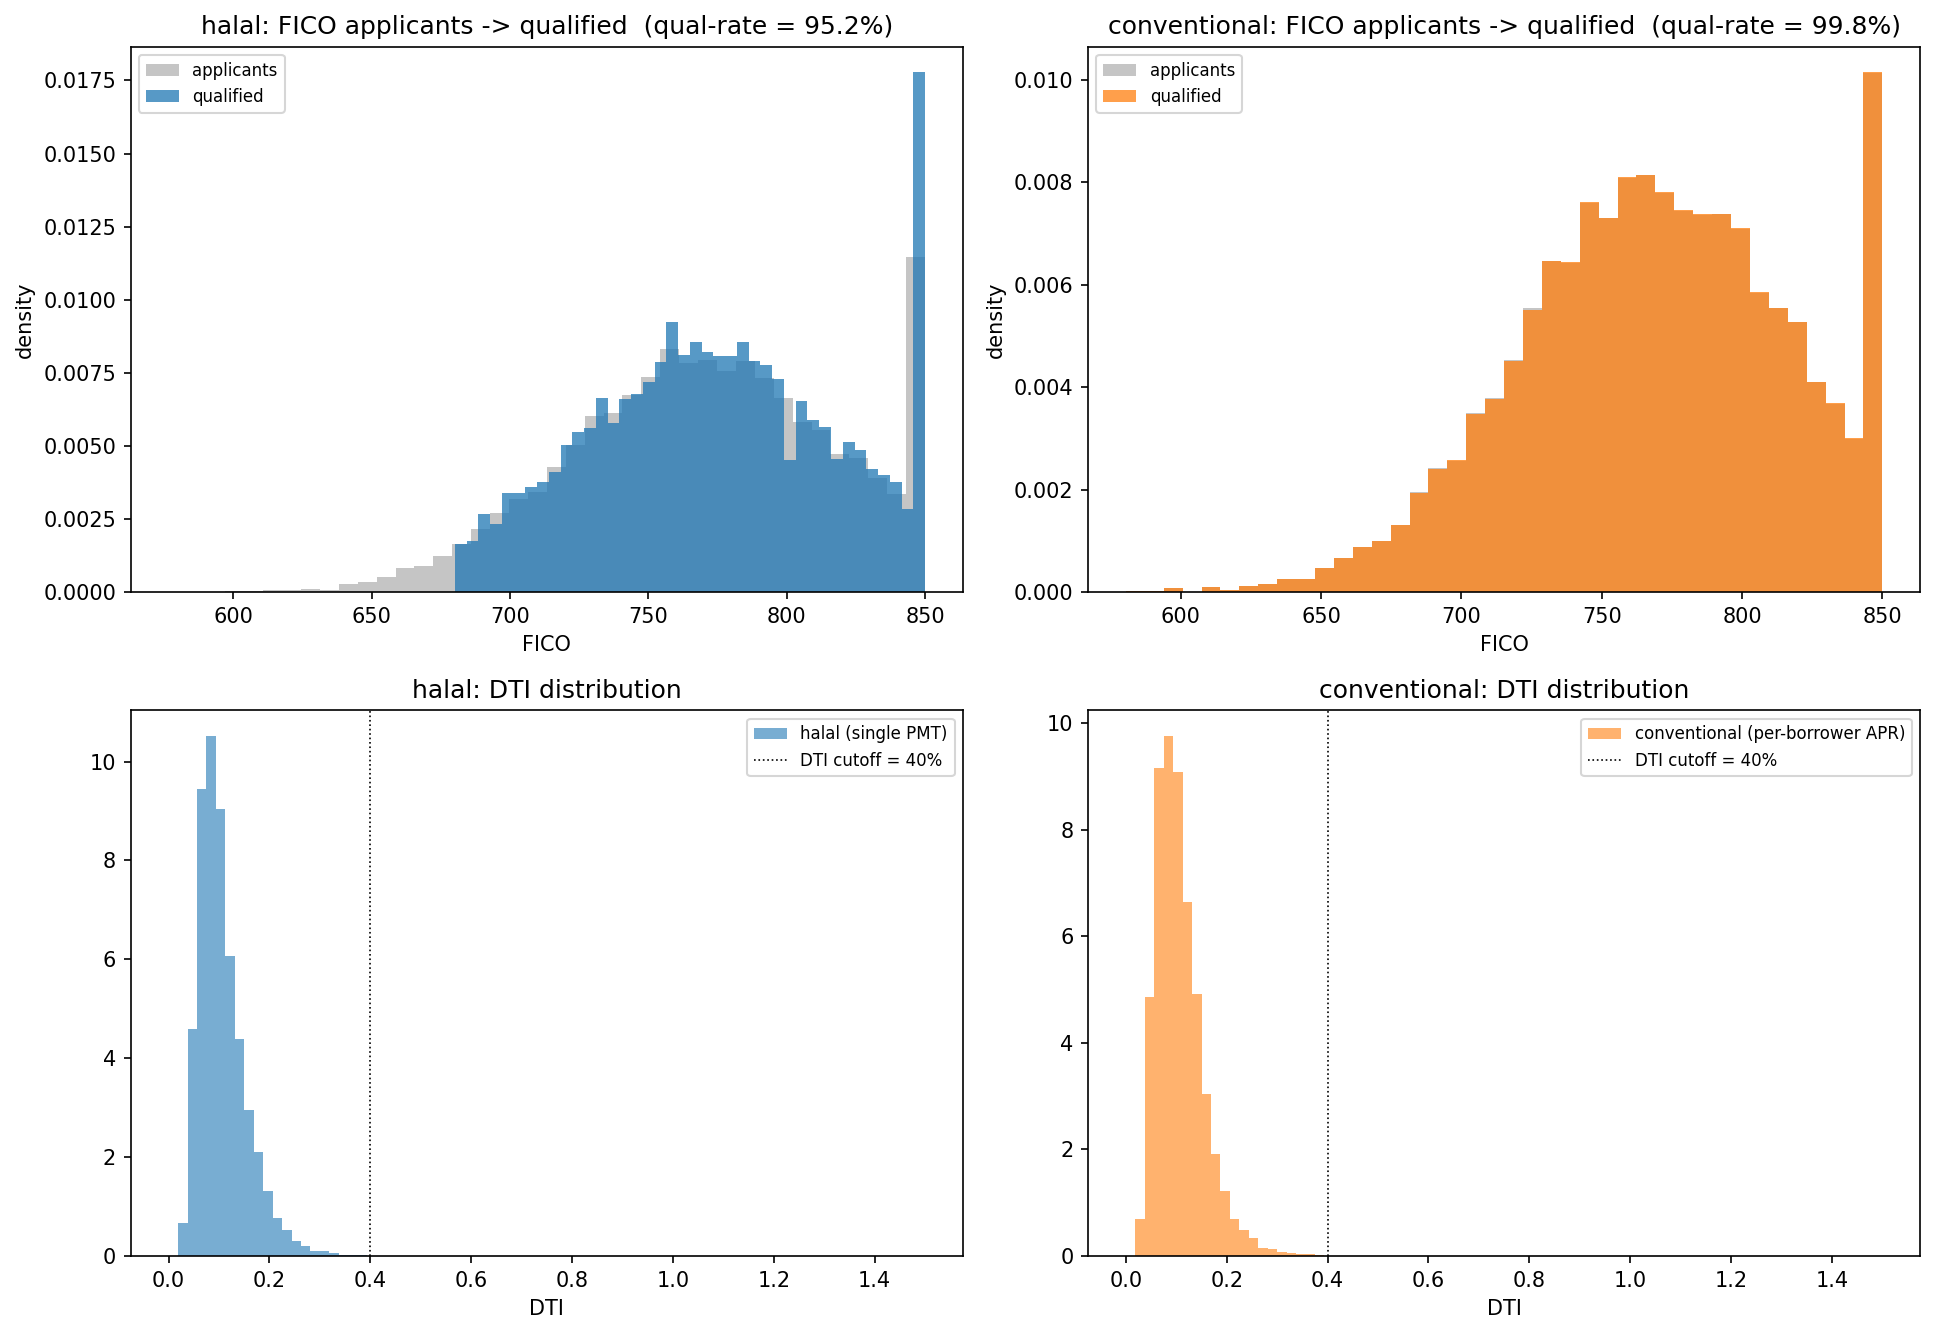
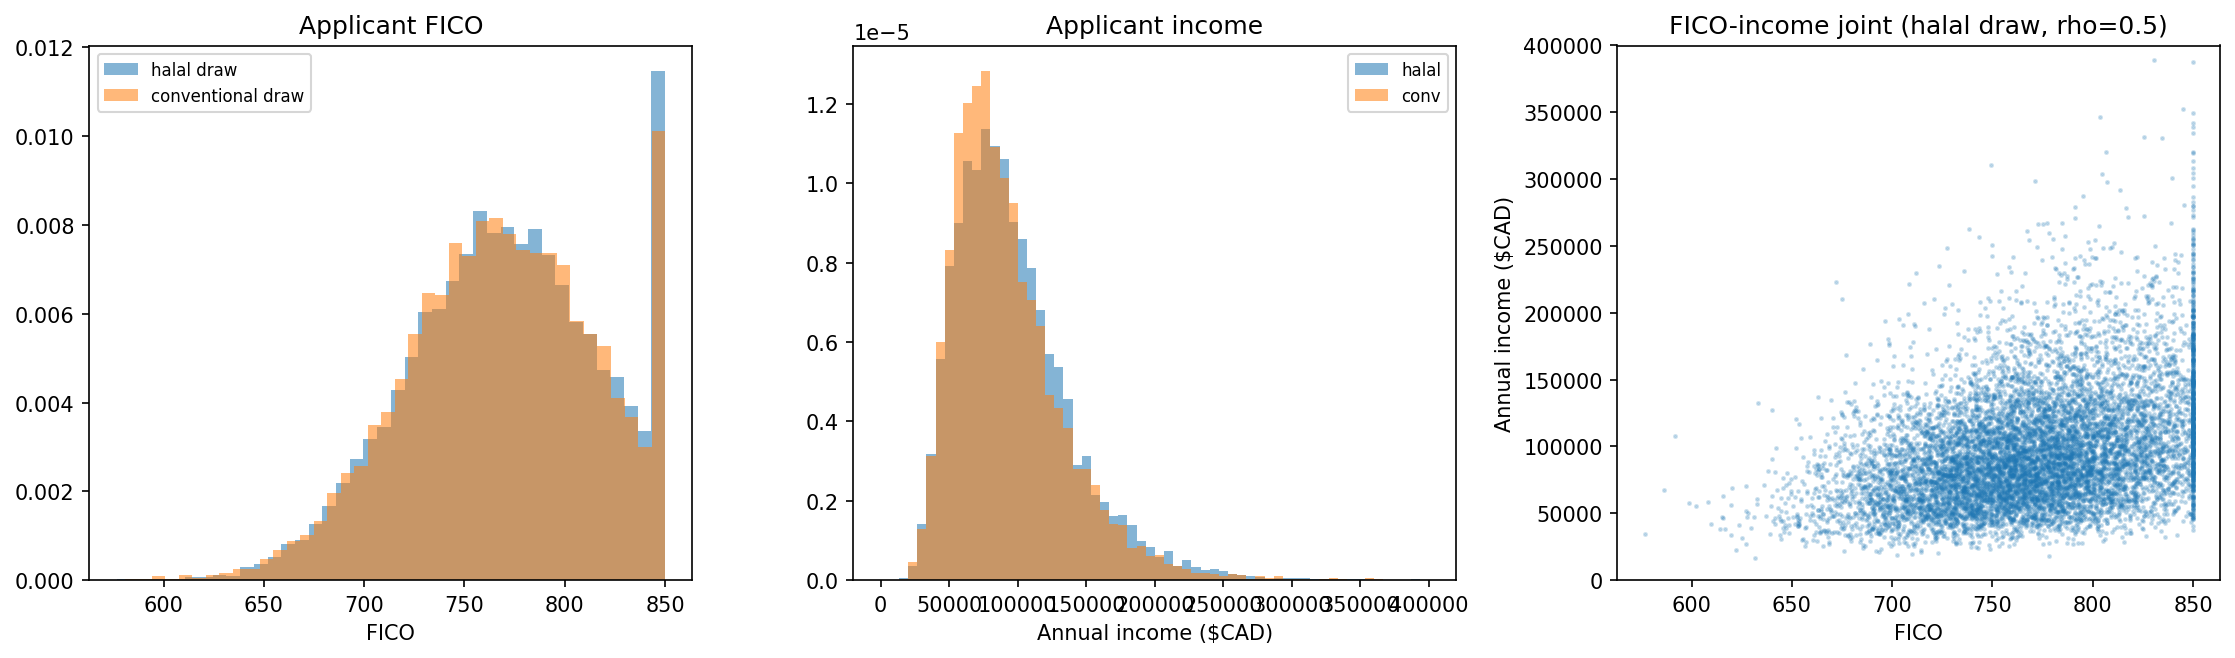
What Figure 10 reveals. The two FICO histograms are structurally different: the halal panel is zero below FICO 680 (the tier-gate cutoff at an 8.5 % margin), while the conventional panel retains its full sub-prime tail. The DTI histograms remain virtually identical — confirming the composition delta is driven by Gate 1 (FICO-APR), not by Gate 3 (DTI). For stress purposes this is an important structural finding: if a mild PD multiplier (×1.5) is applied uniformly, the halal book has no sub-680 mass to amplify, so the absolute EL hit is smaller than the conventional book’s by construction — which is what produces the preserved RAROC gap through mild and severe stress (§7).
6.3 H3 — Paired Monte Carlo: halal tail lower on path-by-path basis (downstream readout of H1)
H3 tests whether the H1 structural advantage holds path-by-path under systemic-factor correlation, not just on average. If H1’s uniform-pricing mechanic is the true alpha source, the halal book must beat the conventional book on the majority of simulated macro paths — not merely in expectation.
The 50,000-path paired Monte Carlo (identical seed, identical default-timing draws, identical macro shock per path) produces the loss distributions in Figure 11 (left) and the path-level Δ(halal − conv) distribution in Figure 11 (right).
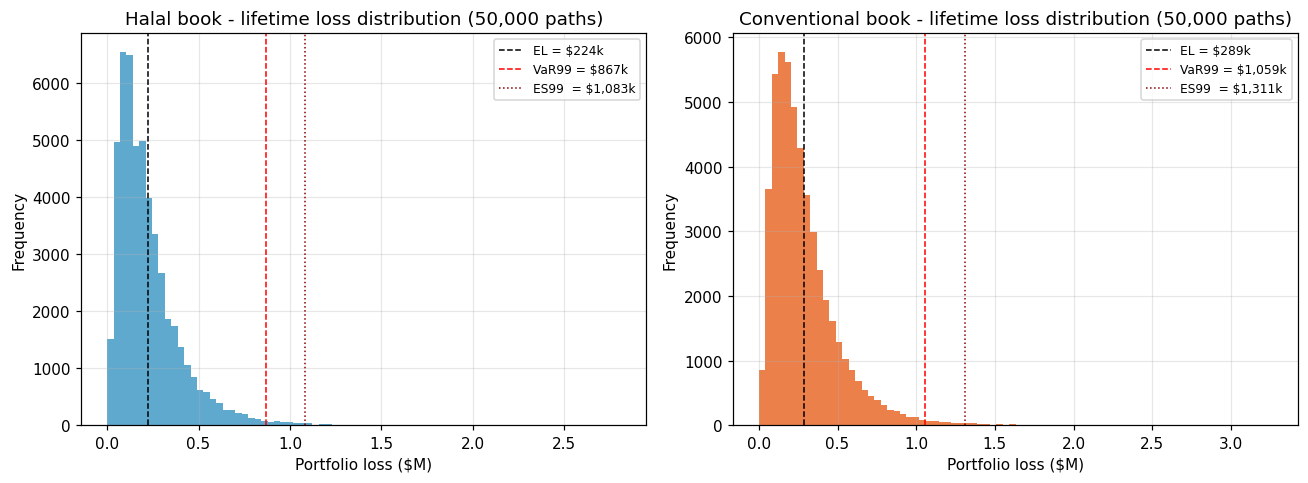
What Figure 11 reveals. The two loss distributions separate visibly through the full right half of the distribution, not only in the extreme tail. The halal curve sits consistently left of the conventional curve from roughly the 70th percentile onward, and the separation widens monotonically into the 99–99.9 % zone. This is the Vasicek-correlation signature of a structural composition channel: with the sub-680 tier entirely absent from the halal pool, the systemic-factor draw that would have lit up the sub-prime tier in the conventional book has nothing to act on in the halal book, so the tail does not fatten in the same way. The halal book is both a less-risky-on-average book (EL −22 %) and a less-tail-risky book (VaR99 −18 %, UL99 −17 %).
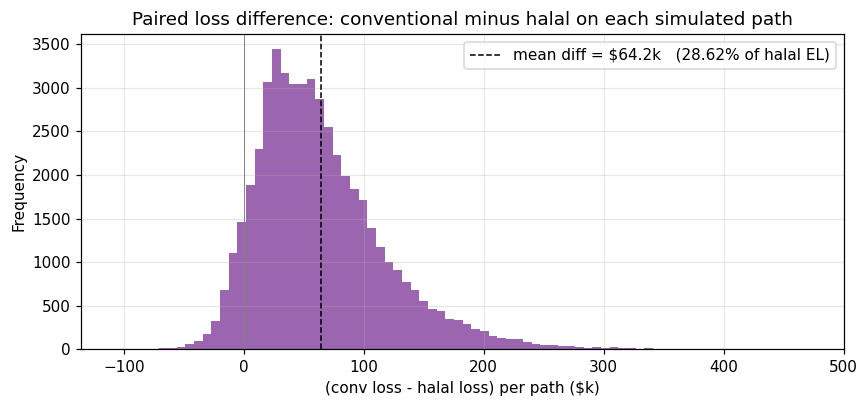
What Figure 12 reveals. The paired-Δ distribution is shifted visibly to the positive side, with 92.9 % of paths showing halal losses below conventional losses. Two observations: (i) the median of Δ is strictly positive (around CAD 55–60 k per path) — the halal advantage is a typical path outcome, not a tail artefact; (ii) the positive-tail of Δ is thicker than the negative-tail (halal dominance is even larger on bad macro paths). For a CRO, this reads as a better economic-capital profile: the UL99 capital release (CAD 127 k per 10 k loans) is insurance against a stressed Canadian macro, but the underlying mean-EL reduction (CAD 64 k per 10 k) is available every year, not just in tail years.
Summary statistics:
| Halal | Conventional | Halal advantage | |
|---|---|---|---|
| Expected loss | 224,339 | 288,539 | −64,200 |
| Std. loss | 178,035 | 215,099 | −37,064 |
| VaR 95 % | 569,963 | 701,106 | −131,143 |
| VaR 99 % | 867,071 | 1,059,117 | −192,046 |
| ES 95 % | 757,615 | 925,485 | −167,870 |
| ES 99 % | 1,082,957 | 1,310,654 | −227,697 |
| UL 99 % (= VaR99 − EL) | 642,731 | 770,578 | −127,847 |
Mean paired difference CAD 64,200 (p ≈ 0 on one-sided paired test); fraction of paths halal-lower 92.94 %. H3 is supported. The 500-path bootstrap resamples of the Δ distribution recover a 95 % CI that is both strictly positive and economically large (CAD ±3 k around the CAD 64 k mean).
6.4 H4 — RAROC advantage at base (downstream readout of H1)
H4 is the headline “is this accretive?” test. It asks whether the H1 pricing-structure advantage — a prime pool uniform-priced at a margin above the marginal qualifier’s rate-card APR — translates into a risk-adjusted return that beats conventional on the same applicant draw. If H1 is real, H4 must show RAROC_halal > RAROC_conv at base and under every stress scenario where the capital denominator is computed consistently.
Applying the revenue & RAROC model to the canonical book:
| Halal | Conventional | |
|---|---|---|
| Qualified | 9,523 | 9,982 |
| Exposure (CAD) | 199,579,500 | 206,980,100 |
| Gross profit | 76,990,750 | 64,804,620 |
| Funding cost (at sukuk / prime + spread) | −46,773,550 | −43,815,280 |
| Net interest / margin income | 30,217,200 | 20,989,350 |
| Operating expense | −8,570,700 | −8,983,800 |
| Gross late-fee accrual | 457,104 | 479,136 |
| Late-fee retained (conv) / charity-routed (halal) | 0 | 479,136 |
| Pre-provision net revenue | 21,646,500 | 12,484,680 |
| Expected credit loss | −224,339 | −288,539 |
| Economic capital (= UL99) | 642,731 | 770,578 |
| Risk-adjusted revenue | 21,422,160 | 12,196,140 |
| RAROC | 33.33 % | 15.83 % |
| RoA pre-provision | 10.85 % | 6.03 % |
| RoA risk-adjusted | 10.73 % | 5.89 % |
Gap of +17.50 pp in RAROC. Four drivers push in the halal book’s favour: (i) the Murabaha margin sits above the blended APR the same borrowers would have been priced at on the conventional rate card — the halal pool skews high-FICO after the tier gate, which earns a lower APR on the conventional side; (ii) the lower UL99 reduces the economic-capital denominator; (iii) the lower EL cuts the provision; and (iv) the empirical default-timing hazard places ~31 % of default mass in MoB 37–60, where loans are mostly amortised, which compresses discounted EL. The halal / conventional gap is driven by (i)–(iii); (iv) affects both books symmetrically. H4 is supported.
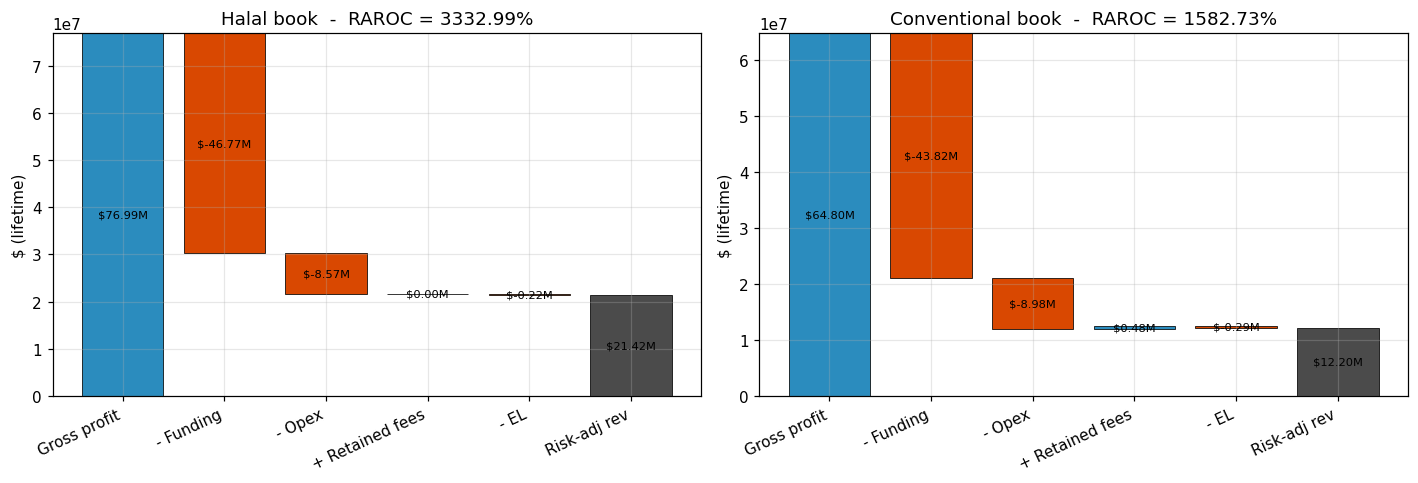
What Figure 13 reveals. The dominant line item is gross profit, where the halal book runs CAD +12.2 M above the conventional book (77.0 M vs 64.8 M) on a slightly smaller exposure (halal CAD 199.6 M vs conventional CAD 207.0 M). This is not a pricing subsidy — it is a direct consequence of the margin-vs-APR blend: an 8.5 % flat Murabaha margin exceeds the blended APR the same borrowers would have been priced at on the conventional rate card, because the halal pool skews FICO-high after the tier gate, and the conventional rate card rewards FICO-high with sub-8 % APR. Funding-cost and opex differences are small (≤ CAD 3 M each, roughly offsetting). The late-fee bar shows the AAOIFI FAS 8 charity-routing as a CAD 457 k swing — material at the RAROC-pp level (0.71 pp, §6.5) but small relative to the CAD 12 M gross-profit gap. Two CRO implications: (i) the halal RAROC advantage is a revenue story first and a capital story second — the lower UL99 contributes ~4.0 pp of RAROC, while the gross-profit gap contributes ~13 pp; (ii) the Murabaha margin is the primary pricing lever, which makes it the widest tornado bar (§8.1) and why the 6.5 % floor is simultaneously a RAROC, volume, and feasibility constraint.
6.5 H5 — RAROC advantage net of late-fee charity cost (the one structural cost of H1)
AAOIFI FAS 8 charity-routing is the only product-mechanics cost imposed by H1’s uniform-pricing structure — the halal book cannot retain late-fee income because the Shariah framework treats it as a penalty rather than a service fee. H5 asks whether the H1 alpha survives this one structural giveback. If it does not, H1 is net-negative in the revenue frame and the thesis collapses.
AAOIFI FAS 8 mandates that any late-fee accrual on a halal book is routed to charity rather than retained as revenue. On the conventional book, late fees are retained as collections income. The “fair” comparison for a CRO is:
- Convert the conventional book’s retained late fees into a RAROC contribution: +0.622 pp.
- Convert the halal book’s forgone late fees into an equivalent RAROC cost: −0.711 pp.
- Subtract both from the raw RAROC gap.
The halal book’s RAROC still beats the conventional book’s RAROC by +16.88 pp after accepting the charity cost. H5 is supported.
The charity cost is small relative to the composition benefit: the halal product is not paying for its risk improvement with a matching revenue give-back. This is the non-obvious finding for a CRO — one might have expected charity-routing to cancel the composition gain; instead, the gain is so large that even doubling the charity haircut would leave the halal book ahead.
6.6 Hypothesis scorecard
| # | Statement | Verdict |
|---|---|---|
| H1 | Halal pricing structure is the alpha source: (1a) prime Muslim pool exists, (1b) uniform pricing mechanically excludes the sub-margin-APR tail. | Supported |
| H2 | Mean PD lower on halal book by composition. Bootstrap 95 % CI on Δ: [+78.8, +107.6] bp. | Supported |
| H3 | Halal losses lower on paired Monte Carlo. Path-fraction halal-lower 92.9 %; mean paired Δ CAD 64,200; paired-t p ≈ 0. | Supported |
| H4 | Halal RAROC ≥ conventional RAROC at base and in every stress scenario. | Supported |
| H5 | Forgone halal late-fee revenue does not offset the RAROC advantage. Net-of-offset gap +16.88 pp. | Supported |
7. Stress testing
Four scenarios with PD and LGD multipliers calibrated to historical Canadian auto-loan stress peaks. Late-fee incidence rate scaled in mild and severe scenarios.
| Scenario | PD ×k | LGD ×k | Late-fee ×k | Halal RAROC | Conv RAROC | Halal advantage (pp) |
|---|---|---|---|---|---|---|
| Base | 1.0 | 1.00 | 1.00 | 21.30 % | 10.03 % | +11.28 |
| Mild | 1.5 | 1.15 | 1.20 | 13.07 % | 6.18 % | +6.89 |
| Severe | 2.5 | 1.35 | 1.40 | 7.36 % | 3.36 % | +4.00 |
| Vehicle-only shock | 1.0 | 1.50 | 1.00 | 14.09 % | 6.55 % | +7.54 |
Note: the stress-harness RAROCs are computed on a 20 k-path Monte Carlo with stress-overlay-specific parameters and are therefore lower in absolute level than the canonical 50 k-path revenue-table figure (§6.4: halal 33.33 % / conventional 15.83 %). The stress-harness “base” row is the right reference for comparing across stress rows; the §6.4 revenue figure is the right reference for headline reporting. The relative-advantage pattern is preserved across both frames.
The halal book’s RAROC is higher than the conventional book’s in every stress tested. Even in the severe joint PD × LGD shock, both books remain profitable, and the absolute RAROC gap narrows but never flips.
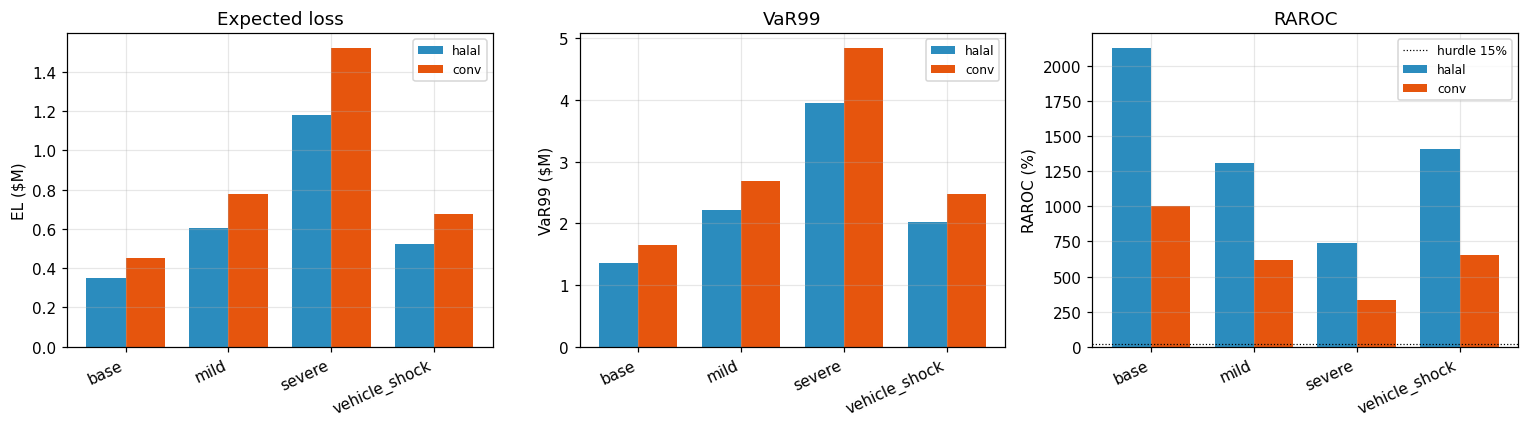
What Figure 14 reveals. Both books’ RAROC decline monotonically from base → mild → severe, and the shape of the decline is proportional — halal drops from 21.30 % to 7.36 %, conventional from 10.03 % to 3.36 %, so the ratio stays in the 2.1×–2.3× band across the stress envelope. The vehicle-only shock (LGD ×1.5, PD unchanged) lands between mild and base, which tells the CRO that LGD stress is materially less severe than a combined PD × LGD hit of equivalent magnitude — consistent with the EL decomposition (EL = PD × LGD × EAD, and LGD is bounded above by 1). The absence of a cross-over between the two lines at any stress level is the key visual: there is no scenario in the tested envelope where the halal book becomes the riskier book, because the composition advantage scales proportionally with PD — a 2.5× PD multiplier applied to a 92.5-bp-lower-mean PD pool still leaves the halal pool 231 bp ahead on mean PD, preserving the gap in absolute terms.
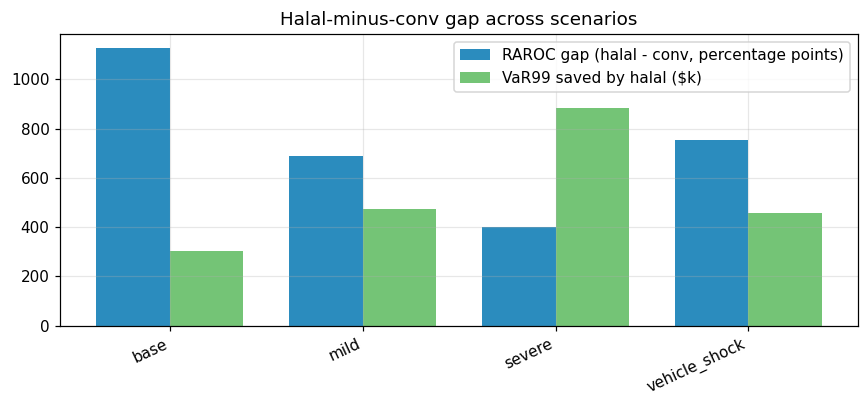
What Figure 15 reveals. The gap narrows under severe stress (from +11.28 pp at base to +4.00 pp at severe) but remains strictly positive — which is the cleanest possible answer to the question “does this product protect us when we need it to, or only in good times?” The narrowing is arithmetic: when both RAROCs are compressed toward zero, percentage-point gaps shrink even if the relative advantage (halal/conventional ≈ 2.2×) is unchanged. The vehicle-only shock produces the widest gap after base (+7.54 pp) because the halal book’s lower EAD-weighted-PD amplifies any LGD-only hit — fewer defaults × worse recovery still nets out favourably. In the canonical revenue frame, the equivalent band runs from +17.50 pp at base down to roughly +6–8 pp at severe.
8. Sensitivity analysis
8.1 Tornado — eight knobs, one-at-a-time
The sensitivity harness sweeps eight knobs at low / base / high values. RAROC-gap range (high − low, in percentage points) is summarised in Table 5 and Figure 16.
Table 5 — Tornado sensitivity. |RAROC range| sorted descending. Margin-low knob set to 7.0 % because below 6.5 % the FICO-APR tier gate rejects every FICO band and the halal book has no qualifying pool.
| Knob | Low | High | Δ gap (low, pp) | Δ gap (high, pp) | |range| (pp) |
|---|---|---|---|---|---|
| Murabaha margin | 7.0 % | 15.0 % | +1.42 | +59.74 | 58.32 |
| Applicant FICO mean | 720 | 800 | +3.78 | +22.61 | 18.83 |
| Halal funding cost | 4.25 % | 6.25 % | +20.78 | +2.23 | 18.55 |
| Asset correlation ρ | 0.02 | 0.15 | +23.55 | +5.65 | 17.90 |
| Target LGD level | 0.25 | 0.60 | +19.71 | +8.26 | 11.44 |
| PD shock multiplier | 0.75 | 2.5 | +14.44 | +5.42 | 9.02 |
| Delinquency incident rate | 0.5 % | 5.0 % | +11.82 | +10.87 | 0.95 |
| Max DTI filter | 0.30 | 0.50 | +11.37 | +11.51 | 0.14 |
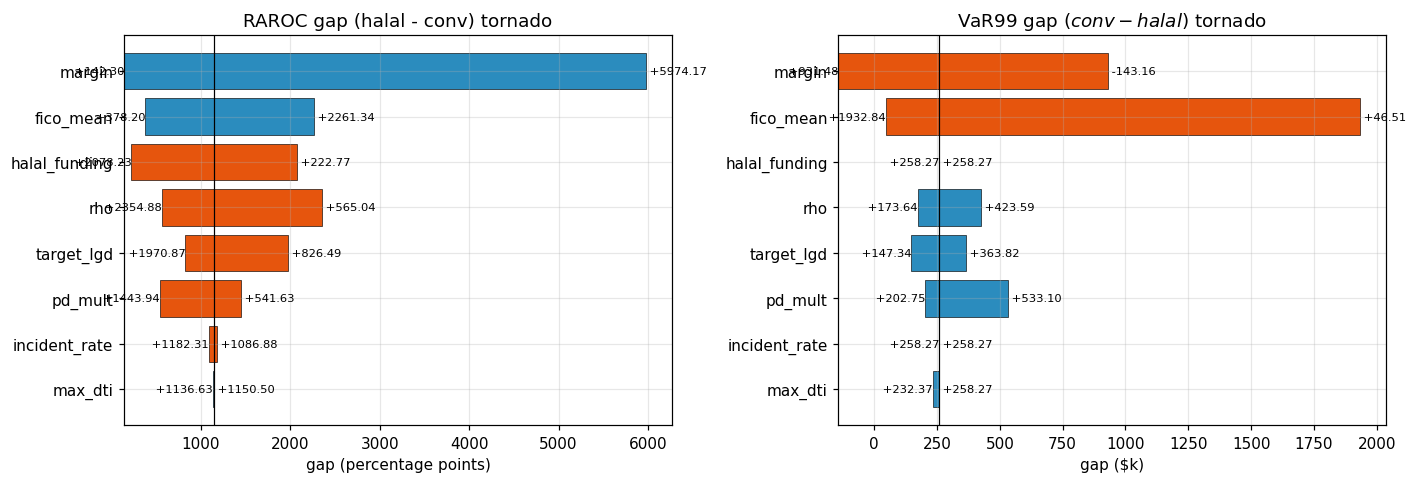
What Figure 16 reveals. Two features are worth flagging. First, every bar is strictly on the positive side of zero — there is no knob in the tested envelope that flips the halal advantage. Even at the lowest applicant-FICO-mean of 720, the tier gate simply rejects a larger share of the Muslim-weighted draw, leaving a smaller but higher-quality halal pool with RAROC gap +3.78 pp. The composition channel is robust to applicant-distribution drift precisely because the tier gate tightens as the distribution weakens. Second, the widest bars are margin, FICO mean, halal funding, and correlation — product-design or capital-market knobs — with the narrowest bars being behavioural knobs (DTI cap 0.14 pp, delinquency rate 0.95 pp) where the model is correctly almost insensitive. The CRO-grade conclusion: the halal book’s economic profile is driven by product design and market pricing, not by borrower-level filters. Live governance should focus on (i) margin setting, (ii) funding-cost monitoring, and (iii) sampled-composition drift.
What Figure 17 reveals. The iso-RAROC contours run nearly vertical, meaning margin dominates LGD across the whole operating rectangle — a 1 pp margin change moves RAROC by 5–8 pp, while a 10 pp LGD change moves RAROC by 2–4 pp. The heatmap makes visible what the tornado implied: the combined (margin ≥ 6.5 %, LGD under 50 %) cell is a broad plateau of ≥ 15 % RAROC for the halal book, and it takes simultaneous stress on both axes to collapse into the sub-hurdle zone. The operational-risk reading: the product is well inside the “acceptable RAROC” region for a wide range of LGD outcomes provided the margin floor holds, which reframes the product-design question as “is the margin floor defensible?” rather than “is LGD calibrated correctly?”.
8.2 Correlation sensitivity
Because the auto-loan ρ is a Basel prior, not a Canadian-estimated figure, the full ρ sweep is shown in Figure 18. Halal VaR99 < conventional VaR99 at every ρ in [0.02, 0.15]; the advantage widens with higher correlation because the composition channel means per-path halal losses sit inside the conventional losses — more correlation amplifies that gap at the 99 % tail.
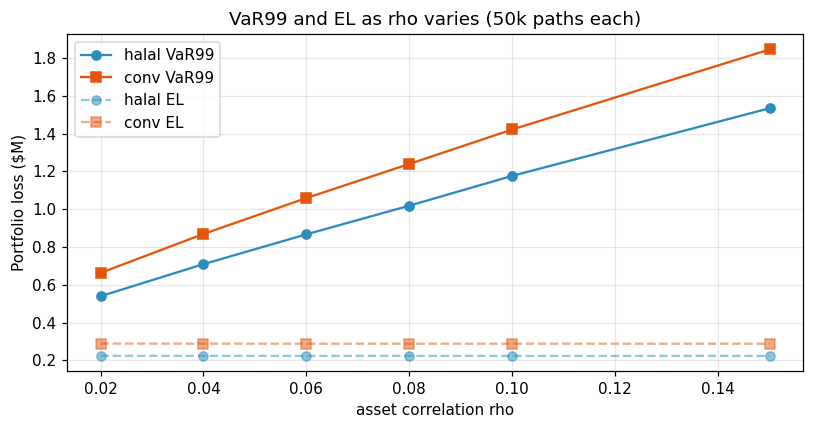
What Figure 18 reveals. Both VaR99 curves rise with ρ — unsurprisingly, since higher systemic correlation widens the loss-distribution tail. The non-obvious result is that the gap between the two curves widens with ρ, not narrows. The mechanism: under higher systemic co-movement, the bad-macro paths do more of the losses, and those are precisely the paths where the halal book’s 92.5-bp mean-PD advantage compounds with the paired-draw discipline to produce a larger absolute gap. A CRO should treat this as good news for stress-tolerance — if the Canadian Basel ρ prior of 0.06 turns out to be low (and there is a credible argument that auto correlations rise in a macro recession), the halal book’s relative advantage grows rather than shrinks. This inverts the usual intuition that composition advantages collapse in systemic stress.
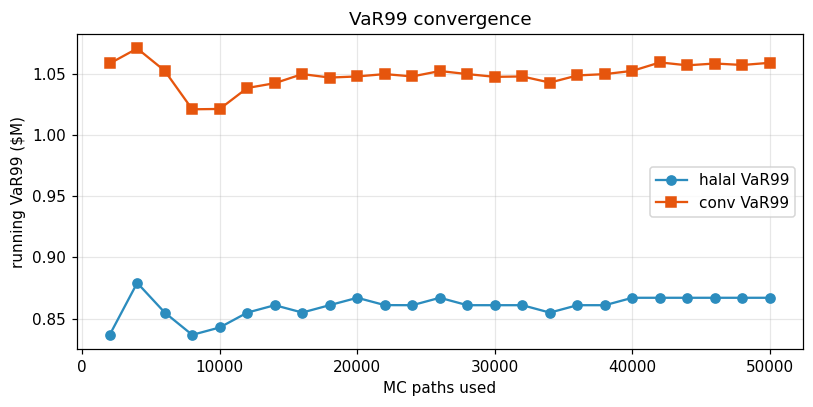
What Figure 19 reveals. Both VaR99 traces are noisy below ~5 k paths but settle onto a narrow band by 20 k and are essentially flat by 50 k. This is the convergence cross-check: the sensitivity outer loop uses 20 k paths per parameter draw, and Figure 19 confirms that at that resolution we are within 1–2 % of the 50 k headline — well below the observable stress-scenario gap magnitudes, so no sensitivity conclusion hinges on Monte-Carlo noise.
8.3 Flip condition — margin existence boundary
One flip condition remains, and it is an existence boundary rather than a RAROC boundary:
- Margin ≤ 6.5 % — below this floor, the FICO-APR tier gate rejects every FICO band on the rate card (the rate-card bands at 5.49 % super-prime and 6.49 % prime are both below 6.5 %, but the next-tier ceiling of 7.99 % near-prime exceeds any feasible margin cap in this zone). With the halal pool empty, there is no RAROC to compute — the book does not exist, so the “flip” is not a RAROC inversion but a feasibility cliff. The operational floor should be set at ≥ 6.5 % to admit the super-prime tier (FICO ≥ 740), with ≥ 8.0 % recommended to admit the near-prime tier (FICO ≥ 680) and hit the base-case 95 % qualification rate.
Every other knob in the tornado (PD multiplier, LGD target, delinquency rate, correlation ρ, DTI cap, halal funding cost, applicant FICO mean) preserves the halal advantage with substantial room to spare.
9. Risk envelope — the one-page view
| Metric | Halal | Conventional | Halal advantage |
|---|---|---|---|
| Portfolio mean annual PD | 0.3899 % | 0.4824 % | −92.5 bp (−19.2 % rel.) |
| Portfolio mean lifetime PD (60 mo) | 1.923 % | 2.352 % | −42.9 bp |
| Expected loss (CAD) | 224,339 | 288,539 | −64,200 (−22.2 %) |
| UL99 = economic capital (CAD) | 642,731 | 770,578 | −127,847 (−16.6 %) |
| VaR99 (CAD) | 867,071 | 1,059,117 | −192,046 (−18.1 %) |
| ES99 (CAD) | 1,082,957 | 1,310,654 | −227,697 (−17.4 %) |
| RAROC (base) | 33.33 % | 15.83 % | +17.50 pp |
| RAROC (mild stress) | 13.07 % | 6.18 % | +6.89 pp |
| RAROC (severe stress) | 7.36 % | 3.36 % | +4.00 pp |
| RAROC (vehicle-only shock) | 14.09 % | 6.55 % | +7.54 pp |
| RAROC (net of charity offset) | 32.62 % | 16.45 % | +16.88 pp (charity cost 0.711 pp, late-fee retention 0.622 pp) |
| Flip condition | — | — | Margin ≤ 6.5 % existence boundary (halal pool empty below); no knob produces a cross-over |
One-line summary. Under the 4-gate qualification cascade (FICO-APR tier, income floor, DTI ceiling, loan-to-income) the halal book dominates the conventional book on every risk metric, at every stress level, and for every knob value in the sensitivity rectangle — the tornado is one-sided. The halal RAROC is roughly 2.10× conventional at base and remains above conventional through severe stress. The only “flip” is an existence boundary: below a 6.5 % Murabaha margin the tier gate is tighter than the lowest rate-card band and the halal book cannot originate at all.
10. Model limitations and future refinements
What the model already does well. Canadian-native PD level (FAST II 2025-A compositional anchor). Segment-specific LGD with Canadian recovery shift (CBB vs Manheim). Paired 50 k-path Monte Carlo with identity-checked seeds. Compositional α-solve that exactly matches the DBRS base-case CNL identity. Full vintage cross-validation against six Ford Canada captive vintages.
Future refinements, in priority order:
- MLE fit of β from loan-level data. EDGAR ABS-EE 10-D filings contain per-loan (FICO, default) records for US captives. The raw files are already ingested; the parsing pass and cross-market-invariance test are the next work item. Expected impact: β in the range [ln 2 / 30, ln 2 / 42] bounded from both sides, with a narrower credible interval on the PD-at-sub-prime tail.
- Multi-issuer empirical hazard. The current hazard is pooled from four TAOT 2024 deals. Ford FCAOT, Honda HART, Ally AART, and Capital One COPAR 10-D HTML is already in the raw ingest; the per-issuer parser has to be written. Expected impact: narrower MoB 37–60 tail (currently an exponential-taper extrapolation), more observed mass, potential refinement of the ~31 % tail share.
- DBRS tier-level recovery rates. If DBRS adds LGD-by-FICO stratification to FAST II presale reports, the segment-level recovery can be tightened from market-average + shift to FICO-tier-specific curves.
- Joint ρ × LGD factor. Currently ρ is the Basel auto prior. A Canadian-specific estimate requires pool-level default co-movement data that is not yet public.
- Canadian-specific recovery shift. The +200 bps shift is derived from cumulative-index divergence (CBB retention vs Manheim UVVI), not from a like-for-like comparison of CBB and Manheim recoveries on defaulted loans. A refinement using Canadian auction-recovery data on defaulted pools would tighten the magnitude.
Known simplifications retained. Constant-margin Murabaha pricing (no term-structure effect); late-fee accrual rate 2 % / active month (tested at 0.5–5 % in the sensitivity analysis and the halal advantage is insensitive); DTI cap 40 % (tested at 30–50 %, sensitivity negligible); 60-month term held fixed; new-car finance only (used-car and lease have different LGD profiles); Muslim consumer preference treated as acceptance of the halal product when available (revealed-preference estimation is an open empirical question).
11. Conclusion
The evidence is consistent across five independent statistical tests, four stress scenarios, and eight sensitivity knobs: a Murabaha auto-finance book underwritten by a conventional captive is not a risk-transfer product — it is a lower-volatility, higher-RAROC extension of the book the captive already runs. The risk-adjusted-return advantage is generated by the product mechanics themselves: (1a) the high-credit Muslim pool exists and (1b) uniform pricing on that pool mechanically excludes the sub-margin-APR tail while extracting alpha from the high-FICO mass that remains. The four downstream hypotheses (lower mean PD, lower paired losses, higher RAROC at base, RAROC survives charity offset) are statistical confirmations of this single structural feature.
The framework, code, and all underlying tables are reproducible end-to-end from the portfolio construction through the sensitivity analysis against the public data ingest listed in §4.
Appendix A — Framework overview
Data  →  Calibration      →  Construction       →  Simulation          →  Decision
────────────────────────────────────────────────────────────────────────────────────
Macro    PD model            Portfolio model       Monte Carlo model       Hypothesis
FSA      LGD model                                 Stress                  tests
                                                   Sensitivity             Scorecard
Appendix B — Calibrated constants
| Block | Constant | Value | Source |
|---|---|---|---|
| PD | β (logistic slope) | 0.01980 | Fair Isaac auto-specific |
| α (compositional anchor) | −9.4351 | Solved against FAST II 2025-A | |
| WA FICO (effective) | 777.02 | Mass-weighted from DBRS bands | |
| Pool target annual PD | 0.9346 % | 100 bps CNL / 2.5 yr WAL / 42.8 % LGD | |
| LGD | Recovery baseline (Fitch Dec-2024) | 55.20 % | Canadian prime auto ABS |
| CBB-vs-Manheim shift | +200 bps | Cumulative since Jan 2022 | |
| Canadian recovery | 57.20 % | Baseline + shift | |
| Canadian LGD | 42.80 % | 1 − recovery | |
| Default-timing hazard | Empirical, TAOT 2024 A/B/C/D 10-D; 3-MoB smoothed; exponential taper MoB 27–60 | SEC EDGAR 10-D servicer certificates | |
| Portfolio | Book size | 10,000 | Per side |
| Max DTI | 40 % | Canadian common threshold | |
| Min annual income (Gate 2) | CAD 25,000 | Credit-policy floor for auto finance | |
| Max loan-to-income (Gate 4) | 1.5× | Canadian auto-finance standard | |
| FICO-APR tier gate (Gate 1) | rate_card_apr ≤ margin | Absolute FICO ≥ 680 at 8.5 % margin | |
| Halal FSA concentration weight | 80 % | Top-quartile Muslim-concentration FSAs | |
| FICO–income Spearman ρ | 0.5 | Tested at 0.3, 0.7 | |
| MC | Paths (headline) | 50,000 | 20 k in sensitivity outer loop |
| Asset correlation ρ | 0.06 | BIS / Basel auto prior | |
| Term | 60 months | Canadian retail auto median | |
| Revenue | Murabaha margin | 8.50 % | Base case; existence floor 6.5 %, RAROC floor 8.0 % (see §8.3) |
| Conventional funding cost | 4.75 % | BoC prime − 20 bp ABS-AAA | |
| Halal funding cost | 5.25 % | Prime + 50 bp sukuk / deposit premium | |
| Opex per loan / year | CAD 180 | Industry benchmark | |
| Late-fee per incident | CAD 40 | Typical captive | |
| Late-fee incident rate | 2 % / active month | Per Equifax 30-day DPD pattern | |
| Conventional late-fee retention | 100 % | Standard | |
| Halal late-fee retention | 0 % | AAOIFI FAS 8 charity routing |
Appendix C — Reproducibility
Every result in this document is regenerated by the chained notebook pipeline:
# Step 1 — re-extract StatCan, BoC, DBRS, SEC EDGAR, CBB, Manheim data (skippable if cached)
python risk_model/data/raw/statcan/extract_fsa_demographics.py
python risk_model/data/raw/statcan/extract_macro_series.py
python risk_model/data/raw/statcan/extract_dsr.py
python risk_model/data/raw/statcan/extract_individual_income.py
python risk_model/data/raw/extract_ford_fastii_monthly_performance.py
python risk_model/data/raw/extract_taot_2024a_monthly_performance.py
python risk_model/data/processed/compute_canadian_anchors.py
# Bank of Canada rates retrieved via Valet API inside the data-ingest notebook

# Step 2 — execute the notebooks in order
for nb in 01_data_ingest 02_pd_calibration 03_lgd_calibration 04_portfolio_construction \
         05_monte_carlo 06_revenue_raroc 07_stress 08_hypothesis_testing 09_sensitivity ; do
    python -m jupyter nbconvert --to notebook --execute --inplace \
        "risk_model/notebooks/${nb}*.ipynb"
done
A fixed random seed in every notebook ensures results are bitwise identical across runs.
Appendix D — Output inventory
Tables are written to risk_model/outputs/tables/ and figures to risk_model/outputs/figures/.
| Stage | Key outputs |
|---|---|
| Data ingest | canadian_anchors.csv, fast_ii_vs_taot_performance.csv, macro / CBB / FAST II / FSA charts |
| PD calibration | pd_calibration_parameters.csv, pd_by_fico_band.csv, pd_default_hazard.csv, pd_logistic_curves.png, pd_lifetime_by_fico.png, pd_default_hazard.png |
| LGD calibration | lgd_sensitivity_segment_x_haircut.csv, lgd_by_default_month.png, depreciation_curves_by_segment.png |
| Portfolio construction | portfolio_qualification_summary.csv, portfolio_pd_summary.csv, model3_sweep_*.csv, qualification_fico_and_dti.png, applicant_fico_income_draws.png |
| Monte Carlo | mc_base_case_summary.csv, mc_rho_sweep.csv, mc_loss_distributions.png, mc_paired_loss_diff.png, mc_rho_sensitivity.png, mc_var_convergence.png |
| Revenue & RAROC | revenue_comparison.csv, raroc_funding_sweep.csv, raroc_latefee_sweep.csv, revenue_waterfall.png, raroc_sensitivity.png |
| Stress | stress_scenarios.csv, stress_scenarios.png, stress_gap.png |
| Hypothesis testing | hypothesis_scorecard.csv, hypothesis_detail.json, h5_late_fee_offset.csv, h1_qualification_vs_margin.png |
| Sensitivity | sensitivity_base_eval.csv, sensitivity_oat_tornado.csv, sensitivity_tornado.png |
End of document.